


Financial News
My Watchlist for Wednesday, February 01
January 31, 2017 at 17:45 PM EST
 ( click to enlarge )
Juno Therapeutics Inc (NASDAQ:JUNO) broke through that critical 20.8 level today on solid volume. There is a high probability for a trend continuation in the next sessions, as the stock could test the next key resistance level in the 23 area.
 ( click to enlarge )
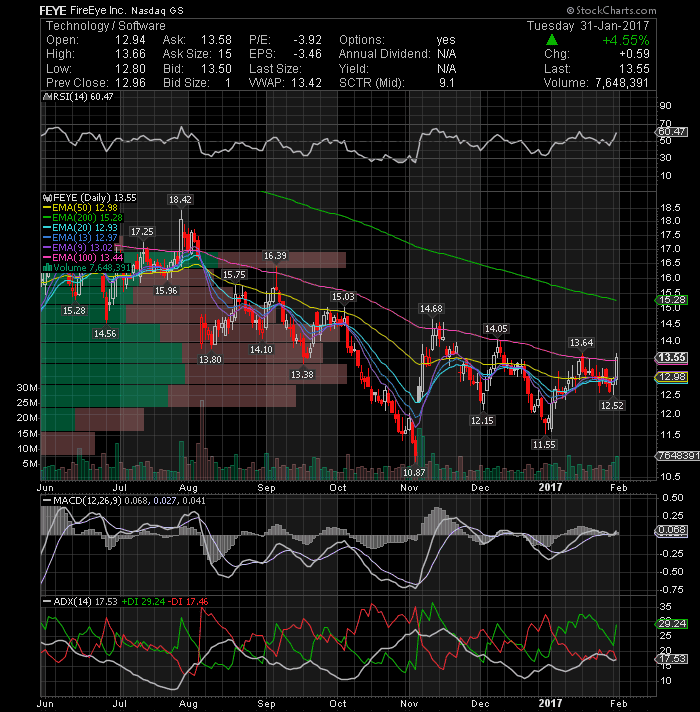
FireEye Inc (NASDAQ:FEYE) broke and closed above its declining EMA100 accompanied by high volume, so keep an eye on it to see if tomorrow will confirm the breakout. Indicators are looking bullish.
 ( click to enlarge )
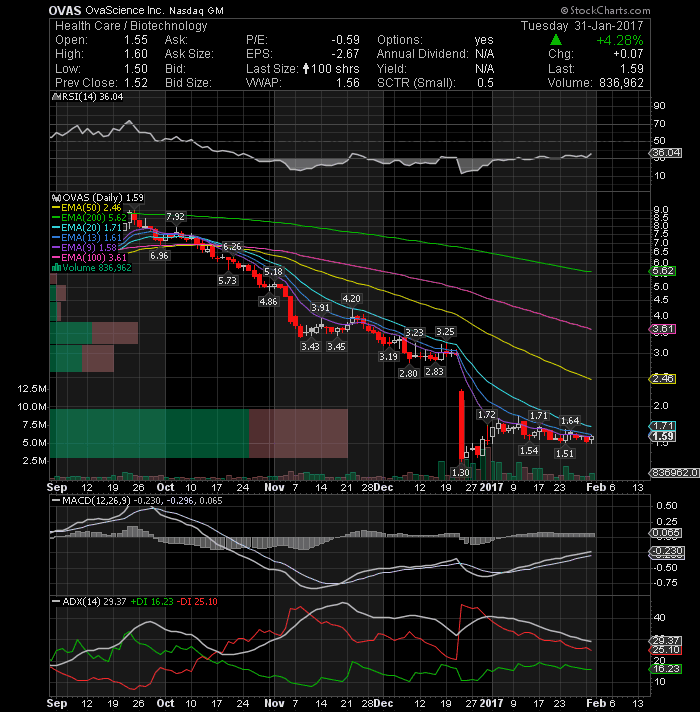
OvaScience Inc (NASDAQ:OVAS) made a nice upside reversal in a weak market today after Blackrock has reported a stake of more than 5 percent in the company. Let’s see whether the stock can gather enough momentum to break through $1.60 (today's high). Clear break above this key area could trigger further bullish recovery testing 1.81. Immediate support at 1.54 followed by 1.51. I still holding a strong position at current levels.
 ( click to enlarge )
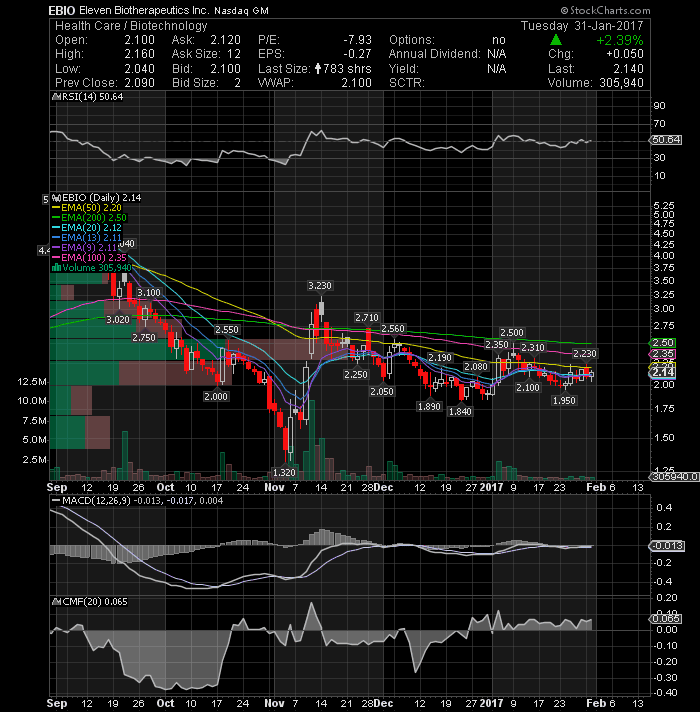
Eleven Biotherapeutics Inc (NASDAQ:EBIO) Coiling up here. Long and will add on break of its EMA50. CMF indicator remains positive, which is a good sign.
 ( click to enlarge )
The share price of Superconductor Technologies, Inc. (NASDAQ:SCON) is showing signs of a potential reversal. Clear break above 1.19 (EMA20) could trigger further bullish recovery testing 1.43 (EMA50).
 ( click to enlarge )
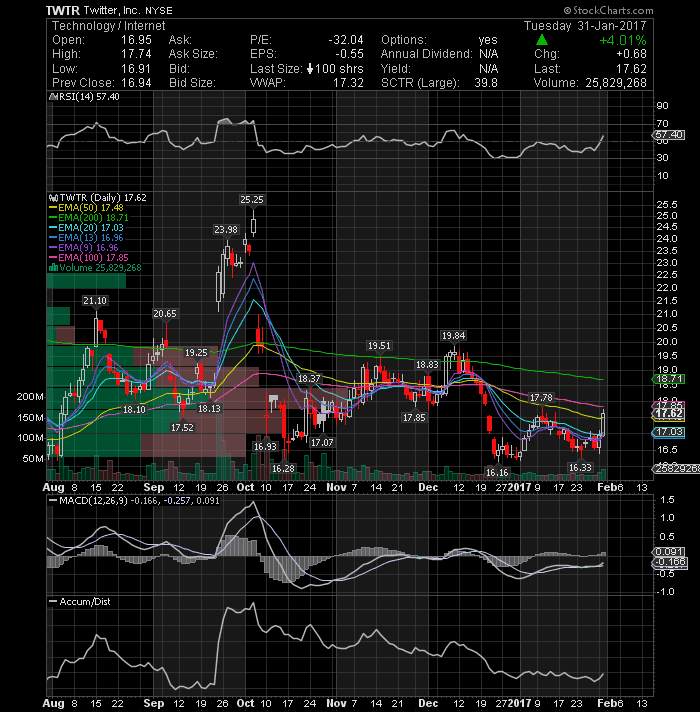
Twitter Inc (NYSE:TWTR) jumped 68c or 4%, Tuesday to close at 17.62, just slightly below its key resistance at 17.78. A break above this level could result in an acceleration to the upside. Short-term Momentum indicators also point to continuation of positive bias. Keep on watch.
 ( click to enlarge )
Allied Healthcare Products Inc (NASDAQ:AHPI) on my swing long list. The stock showed buying strength today. The 2.3-2.4 area is a critical resistance region that can determine overall bias for the stock in short-term.
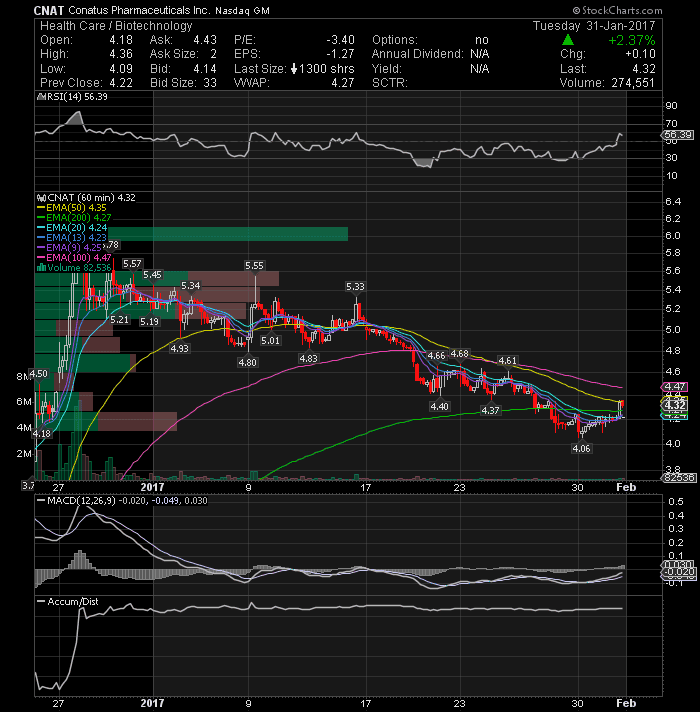 ( click to enlarge )
Conatus Pharmaceuticals Inc (NASDAQ:CNAT) had a great move on the upside today and closed above the 200EMA on hourly chart. The chart above suggests that stock might find now resistance at $4.37. Only a break above this level would suggest further upside, targeting the 4.70 area.
If you want to contact me for advertising opportunities on blog or twitter, then get in touch via email
Disclaimer : This is not an investment advisory, and should not be used to make investment decisions. Information in AC Investor Blog is often opinionated and should be considered for information purposes only. No stock exchange anywhere has approved or disapproved of the information contained herein. There is no express or implied solicitation to buy or sell securities. The charts provided here are not meant for investment purposes and only serve as technical examples. Don't consider buying or selling any stock without conducting your own due diligence.
Thanks for visiting AC Investor Blog.
AC

Data & News supplied by www.cloudquote.io
Stock quotes supplied by Barchart
Quotes delayed at least 20 minutes.
By accessing this page, you agree to the following
Privacy Policy and Terms and Conditions.
Stock quotes supplied by Barchart
Quotes delayed at least 20 minutes.
By accessing this page, you agree to the following
Privacy Policy and Terms and Conditions.