




Financial News
Interface (NASDAQ:TILE) reports sales below analyst estimates in Q3 2026 earnings

Modular flooring manufacturer Interface (NASDAQ: TILE) missed Wall Street’s revenue expectations in Q3 2026, with revenue flat year on year at $366.7 million. The company’s full-year revenue guidance of $1.45 billion at the midpoint came in 1.8% below analysts’ consensus estimates. Its non-GAAP profit of $0.68 per share was 11% above analysts’ consensus estimates.
For more on Interface, read our full research report for free.
Interface (TILE) Q3 2026 highlights:
- Revenue $366.7 million vs S&P analysts’ consensus estimates of $376.7 million (flat year on year, 2.7% miss)
- Adjusted EPS $0.68 vs S&P analysts’ consensus estimates of $0.61 (11% beat)
- Adjusted EBITDA $69.3 million vs analysts’ consensus estimates of $64.04 million (18.9% margin, 8.2% beat)
- Revenue guidance The company dropped its revenue guidance for the full year to $1.45 billion at the midpoint from $1.47 billion, a 1.5% decrease
- Operating margin 15.4%, in line with the same quarter last year
- Free cash flow margin 21.1%, up from 18.1% in the same quarter last year
- Market capitalization $2.19 billion
Revenue growth
Reviewing a company’s long-term revenue performance reveals insights into its quality. Any business can deliver a good quarter or two, but many enduring ones grow for years.
With $1.44 billion in revenue over the past 12 months, Interface is a mid-sized business services company, which sometimes brings disadvantages compared to larger competitors benefiting from better economies of scale.
Interface’s 4.9% annualized revenue growth over the last five years was mediocre. This shows it struggled to generate meaningful demand.
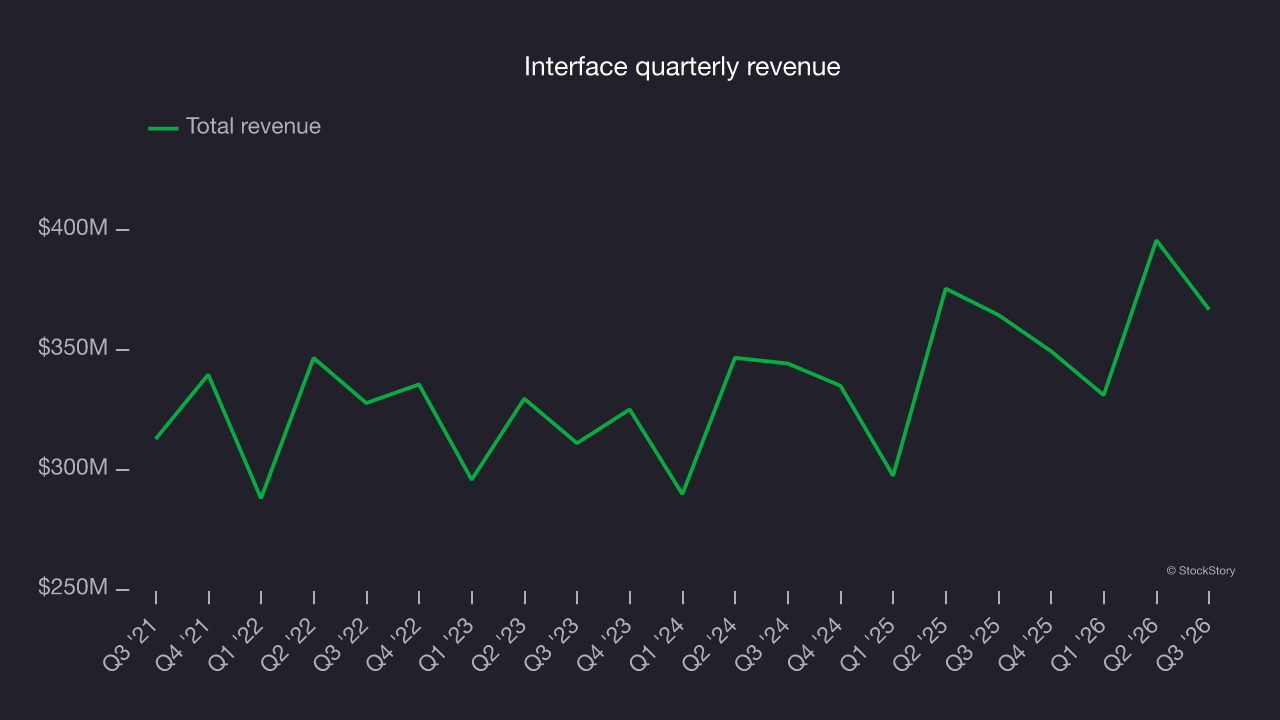
Long-term growth matters the most, but within business services, a half-decade historical view may miss recent innovations or disruptive industry trends. Interface’s annualized revenue growth of 5.1% over the last two years aligns with its five-year trend, suggesting its demand was stable. 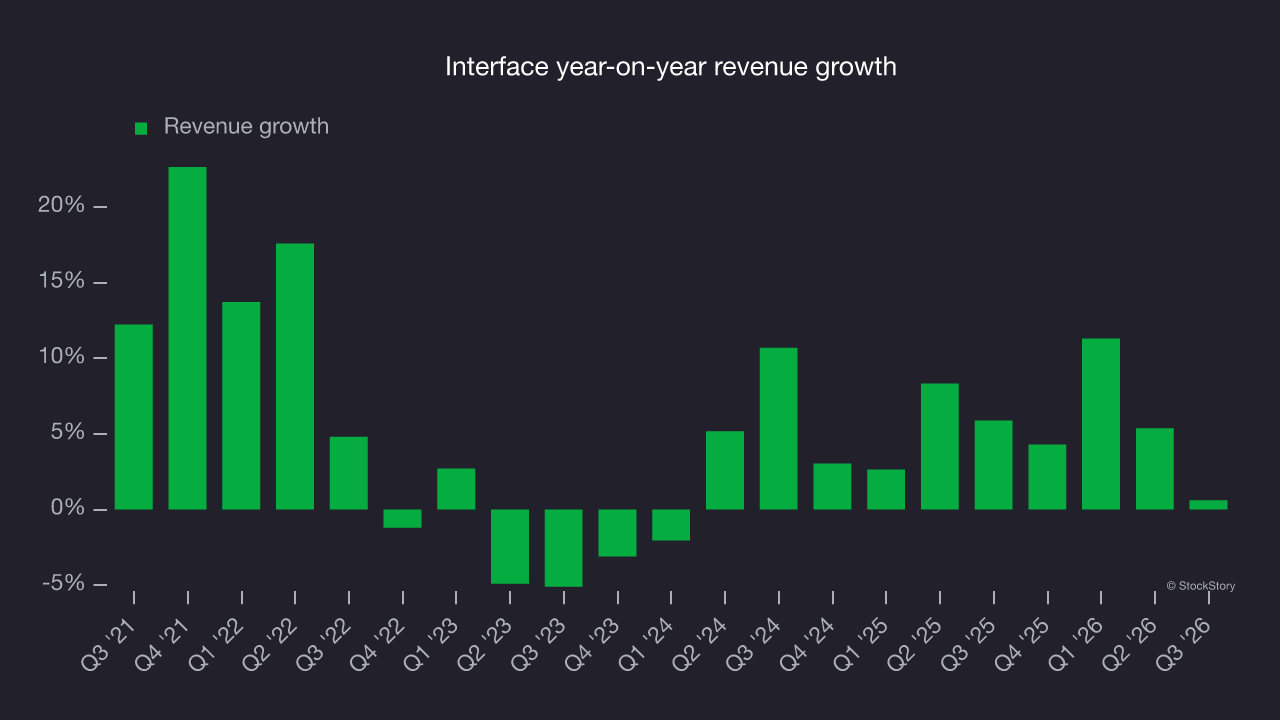
This quarter, Interface’s $366.7 million of revenue was flat year on year, falling short of Wall Street’s consensus estimates.
Looking ahead, sell-side analysts expect revenue to grow 4.1% over the next 12 months, according to S&P, similar to its two-year rate. This projection is underwhelming and suggests its newer products and services will not lead to better top-line performance yet. Still, the company is performing well on other measures of financial health.
Adjusted operating margin
Interface has done a decent job managing its cost base over the last five years. The company has produced an average adjusted operating margin of 11.5%, higher than the broader business services sector.
Looking at the trend in its profitability, Interface’s adjusted operating margin rose by 3.4 percentage points over the last five years, as its revenue growth gave it operating leverage.
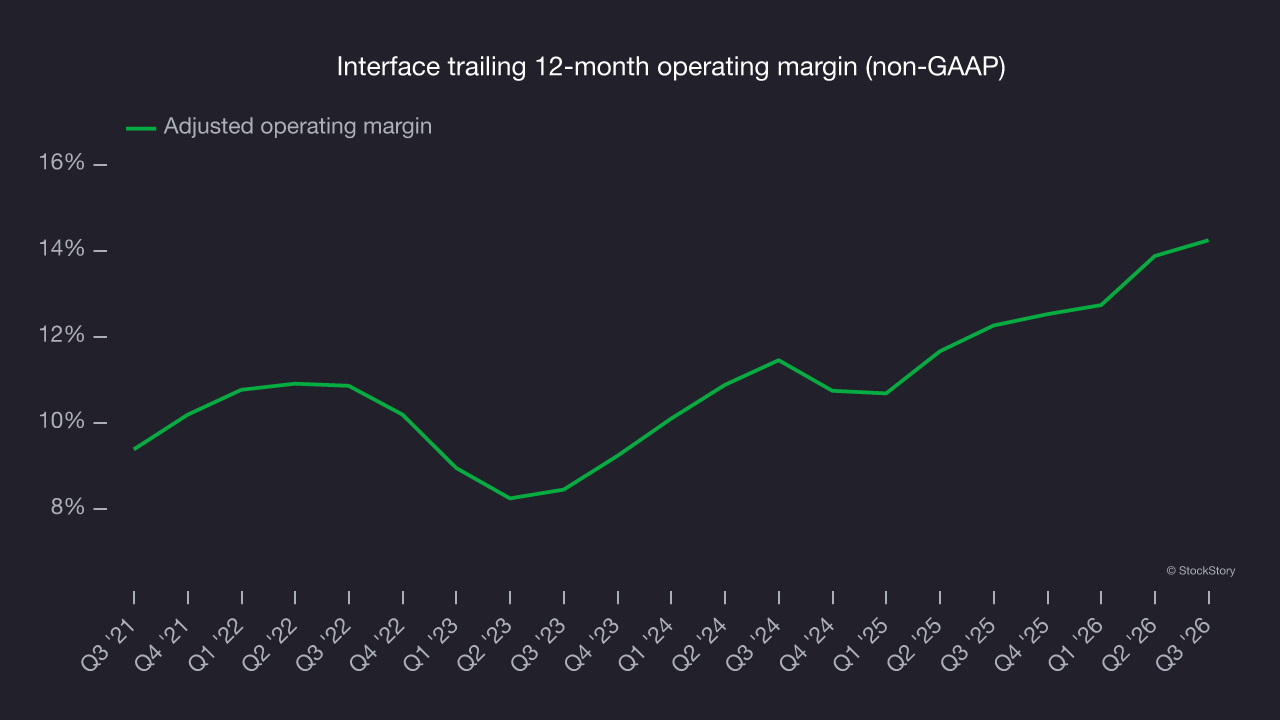
This quarter, Interface generated an adjusted operating margin of 16.3%, up 1.4 percentage points year on year. The increase was a positive sign of improved efficiency.
Earnings per share
Revenue trends explain a company’s historical growth, but the long-term change in earnings per share, or EPS, points to the profitability of that growth. For example, a company could inflate its revenue through excessive spending on advertising and promotions.
Interface’s EPS grew at a 19% compounded annual growth rate over the last five years, higher than its 4.9% annualized revenue growth. This indicates the company became more profitable on a per-share basis as it expanded.
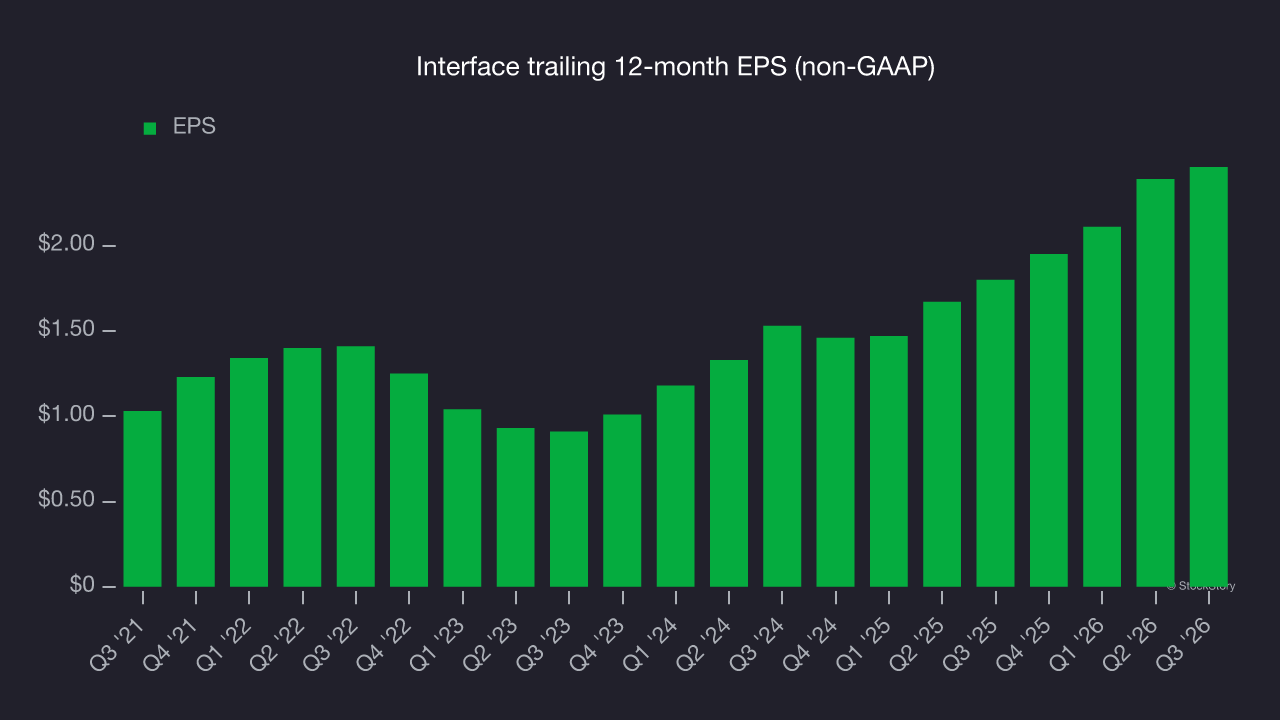
A closer look at Interface’s earnings helps explain the drivers of its performance. As mentioned earlier, Interface’s adjusted operating margin expanded by 3.4 percentage points over the last five years. On top of that, its share count shrank by 1.2%. These are positive signs for shareholders because improving profitability and share buybacks boost EPS growth relative to revenue growth. 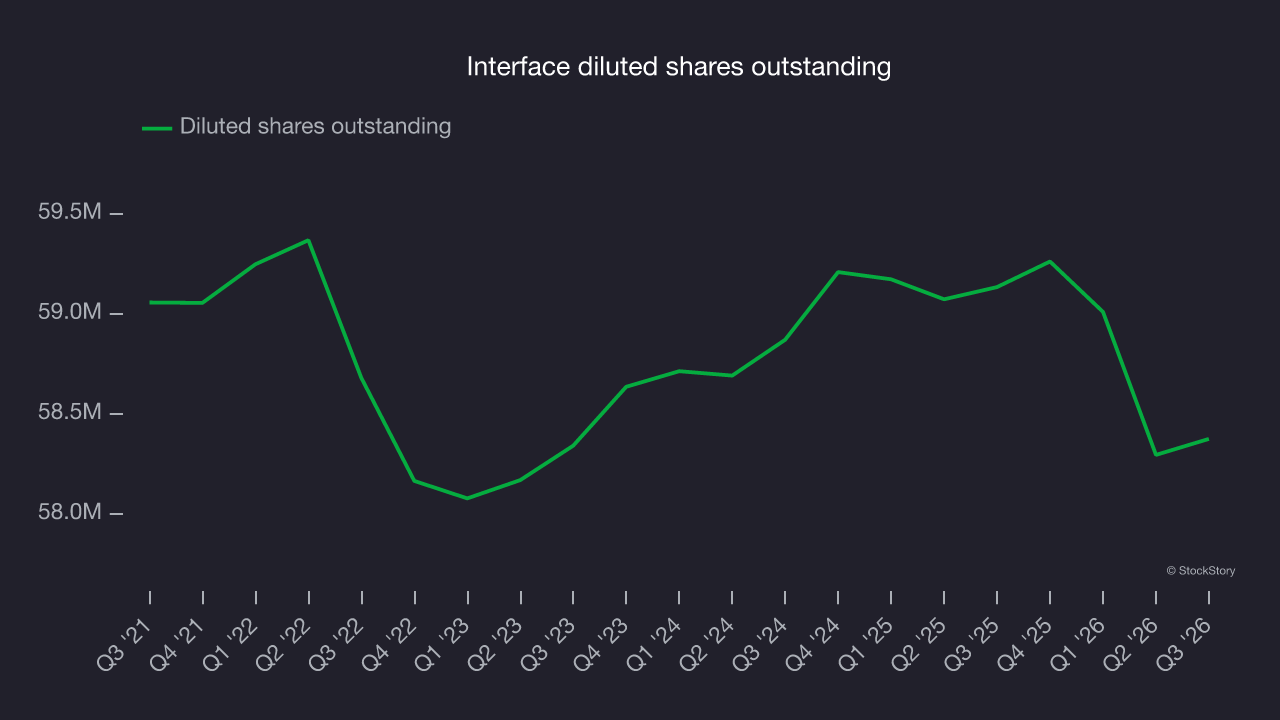
Like with revenue, we analyze EPS over a more recent period because it can provide insight into an emerging theme or development for the business.
For Interface, its two-year annual EPS growth of 26.8% was higher than its five-year trend. That acceleration is a positive sign, particularly given the already high base.
In Q3, Interface reported adjusted EPS of $0.68, up from $0.61 in the same quarter last year. This comfortably beat analysts’ consensus estimates, a positive result for shareholders. Over the next 12 months, Wall Street expects Interface’s full-year EPS to shrink by 6.4% from $2.46 to $2.30, according to S&P.
Key takeaways from Interface’s Q3 results
Interface’s EPS beat wasn’t enough to make this a solid quarter: revenue missed analysts’ consensus estimates, and full-year revenue guidance fell short of Wall Street’s consensus. The quarter could have been better, and shares fell 4.8% to $36 immediately after the results.
Interface had an underwhelming quarter. When assessing the stock at its current price, it’s important to consider its valuation, business quality and latest quarterly results. For more on Interface, read the full research report here (it’s free).
If you believe this article contains misleading, harmful, or spam content, please let us know.
Report this articleMore News
View More




Recent Quotes
View MoreQuotes delayed at least 20 minutes.
By accessing this page, you agree to the Privacy Policy and Terms Of Service.