




Financial News
Calumet (NASDAQ:CLMT) delivers impressive Q3 2026, stock soars

Specialty products refiner Calumet (NASDAQ: CLMT) beat Wall Street’s revenue expectations in Q3 2026, with revenue up 56.1% year on year to $1.68 billion. Its GAAP profit of $2.91 per share was 73.9% above analysts’ consensus estimates.
For more on Calumet, read the full research report, available free.
Calumet (CLMT) Q3 2026 highlights:
- Revenue $1.68 billion vs S&P analysts’ consensus estimates of $1.34 billion (56.1% year-on-year growth, 25.3% beat)
- EPS (GAAP) $2.91 vs analysts’ consensus estimates of $1.67 (73.9% beat)
- Adjusted EBITDA $347.2 million vs analysts’ consensus estimates of $264 million (20.6% margin, 31.5% beat)
- Operating margin 27%, down from 30% in the same quarter last year
- Free cash flow margin 9.6%, up from 8.5% in the same quarter last year
- Market capitalization $3.81 billion
"The third quarter was exceptional for Calumet, with both of our businesses delivering outstanding results and our deleveraging and growth strategy accelerating by years," said Todd Borgmann, CEO. "Our performance reflects a strong market and years of deliberate positioning through our integrated specialties platform supported by advantaged domestic crude, a world-class renewables business, and a commercial and operational organization executing at an increasingly high level. We are converting this earnings power into lasting shareholder value, retiring over $265 million of high-cost debt in the past four months, reducing interest expense, and advancing a lower risk, highly capital-efficient MaxSAF(TM) expansion. With momentum accelerating across both businesses, Calumet is extremely well-positioned to continue executing our strategy."
Revenue growth
Cyclical sectors like energy often flatter weaker operators during favorable price environments, but a longer-term lens separates those from businesses that can consistently perform across market cycles. Over the last five years, Calumet grew its revenue at a decent 12.9% compounded annual growth rate. Its growth was slightly above the average energy upstream and integrated energy company and shows its offerings resonate with customers.
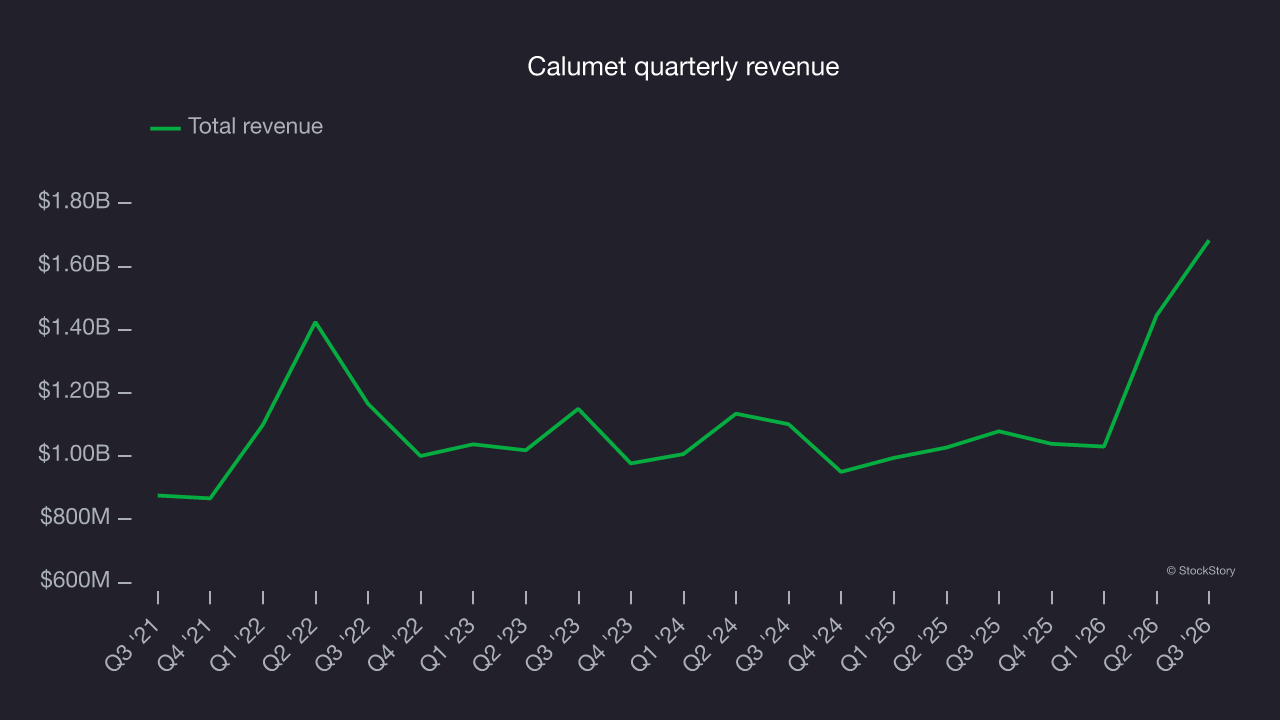
Energy cycles can be long enough that a single five-year period can still reflect one price environment, which is why an additional, decade-long view can help capture through-cycle performance. Calumet’s annualized revenue growth of 3.9% over the last ten years is below its five-year trend, but the results were still good.
This quarter, Calumet reported year-on-year revenue growth of 56.1%, and its $1.68 billion of revenue beat Wall Street’s consensus estimates by 25.3%.
Adjusted EBITDA margin
Calumet was profitable over the last five years but held back by its large cost base. Its average EBITDA margin of 8% was among the worst in the energy upstream and integrated energy sector.
On the positive side, Calumet’s EBITDA margin rose by 4.6 percentage points over the last year, as its revenue growth provided operating leverage.
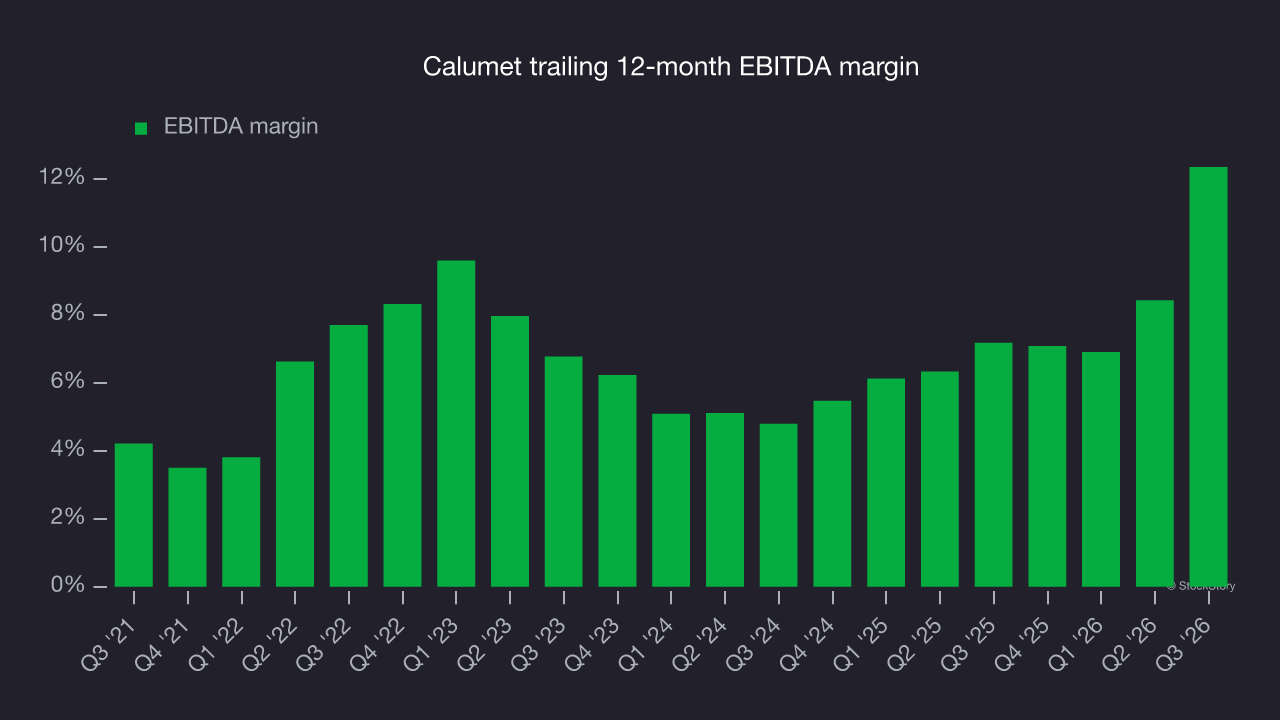
In Q3, Calumet generated an EBITDA margin of 20.6%, up 12.1 percentage points year on year. The increase was a positive sign of greater efficiency. Its adjusted EBITDA beat Wall Street’s consensus estimates by 31.5%.
Free cash flow
Adjusted EBITDA shows how profitable a company’s existing “rock” is before financing and reinvestment, while free cash flow, or FCF, shows how much value remains after paying to replace those wells. Because production declines over time, strong EBITDA can coexist with weak FCF if drilling is expensive or declines are steep. FCF therefore captures both operating efficiency and the cost of sustaining production.
While Calumet posted positive free cash flow this quarter, its longer-term record has been uneven. Calumet’s demanding reinvestment needs have consumed substantial resources over the last five years, contributing to an average free cash flow margin of negative 3%. This means it had a cash outflow of $2.96 for every $100 in revenue.
Absolute FCF margin levels matter, but so does the stability of free cash flow. All else equal, a steady 25.0% average free cash flow margin regardless of commodity prices is preferable to high margins when times are good and negative ones when they’re tough.
Calumet’s ratio of quarterly free cash flow volatility to West Texas Intermediate, or WTI, crude price volatility over the past five years was 19.1 (lower is better), indicating that its cash generation is far more sensitive to commodity-price swings than most peers. This elevated volatility limits its access to capital in downturns and makes it unlikely to act as a consolidator when weaker competitors come under pressure.
Why assess stability against commodity prices at the free cash flow line rather than compare revenue or EBITDA to WTI for Calumet? Because what ultimately matters is not how much revenue or profit a company earns when prices are high but how much cash it can generate when prices are low. Free cash flow is the superior metric because it includes everything from hedging effectiveness to growth and maintenance capex to management behavior during good times and bad.
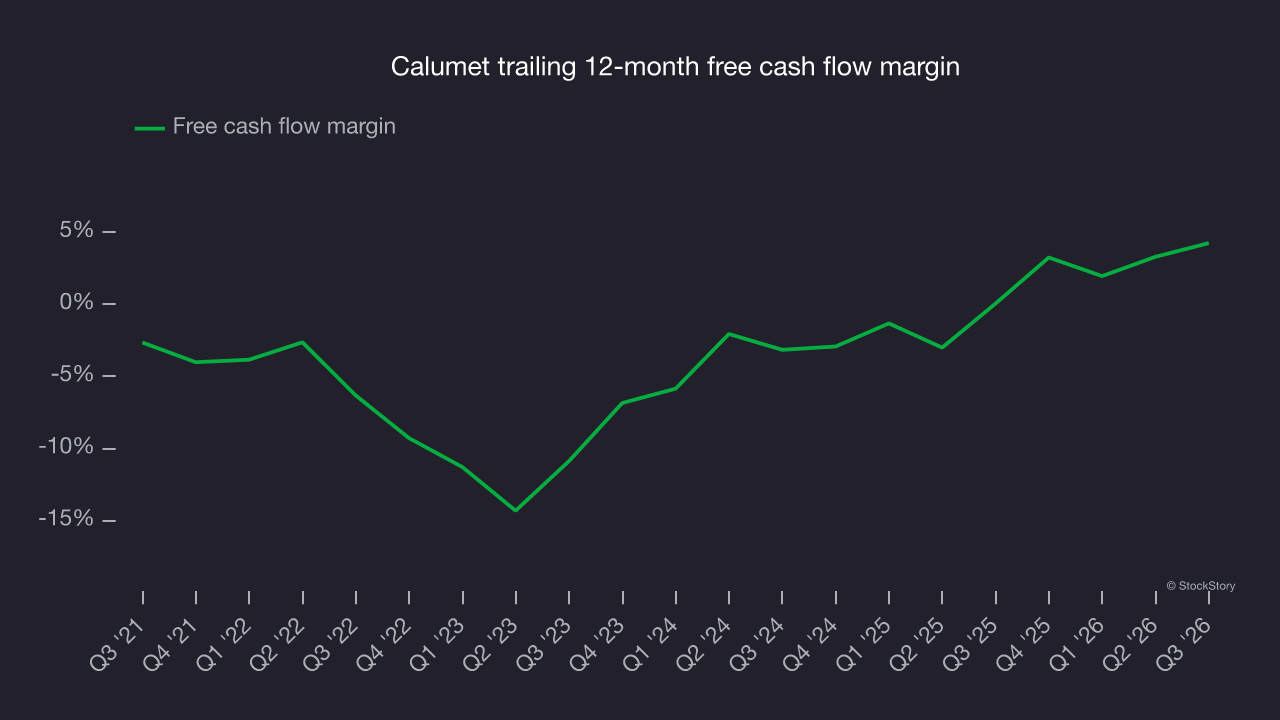
Calumet’s free cash flow came in at $161.3 million in Q3, equivalent to a 9.6% margin. This was a good result, as its margin was 1.1 percentage points higher than in the same quarter last year, building on its favorable historical trend.
Key takeaways from Calumet’s Q3 results
Calumet delivered a solid quarter, with EBITDA beating Wall Street’s consensus estimates by a wide margin and EPS also topping analysts’ consensus expectations. Shares surged 6.2% to $46.05 immediately after the report.
Calumet reported solid earnings, but one quarter doesn’t necessarily make the stock a buy. Assessing it as an investment requires a broader view. That means considering its valuation and business quality alongside the latest quarterly results. For more on Calumet, read the full research report here (it’s free).
If you believe this article contains misleading, harmful, or spam content, please let us know.
Report this articleMore News
View More




Recent Quotes
View MoreQuotes delayed at least 20 minutes.
By accessing this page, you agree to the Privacy Policy and Terms Of Service.