




Financial News
Riley Exploration Permian’s (NYSE:REPX) Q3 2026 sales top estimates

Oil and gas producer Riley Exploration Permian (NYSE: REPX) announced better-than-expected revenue in Q3 2026, with revenue up 88.3% year on year to $201.2 million. Its GAAP loss of $0.11 per share was significantly below analysts’ consensus estimates.
For more on Riley Exploration Permian, read the full research report for free.
Riley Exploration Permian (REPX) Q3 2026 highlights:
- Revenue $201.2 million vs S&P analysts’ consensus estimates of $184.9 million (88.3% year-on-year growth, 8.8% beat)
- EPS (GAAP) -$0.11 vs analysts’ consensus estimates of $2.39 (significant miss)
- Operating margin 53%, an increase from 27% in the same quarter last year
- Free cash flow margin 21%, a decline from 32.4% in the same quarter last year
- Market capitalization $1.04 billion
Bobby Riley, CEO and Chairman of the Board, stated, "Going forward, and based on current market conditions, we plan to continue investing significantly in the development of our assets, supported by our large and growing base of undeveloped inventory, improving third-party infrastructure conditions, and the currently supportive commodity price environment."
Revenue growth
Cyclical industries such as energy can make mediocre companies look great for a time, but a long-term view reveals which businesses can actually withstand and adapt to changing conditions. Over the last five years, Riley Exploration Permian grew its revenue at a strong 30.8% compounded annual growth rate. Its growth surpassed the average energy upstream and integrated energy company and shows its offerings resonate with customers.
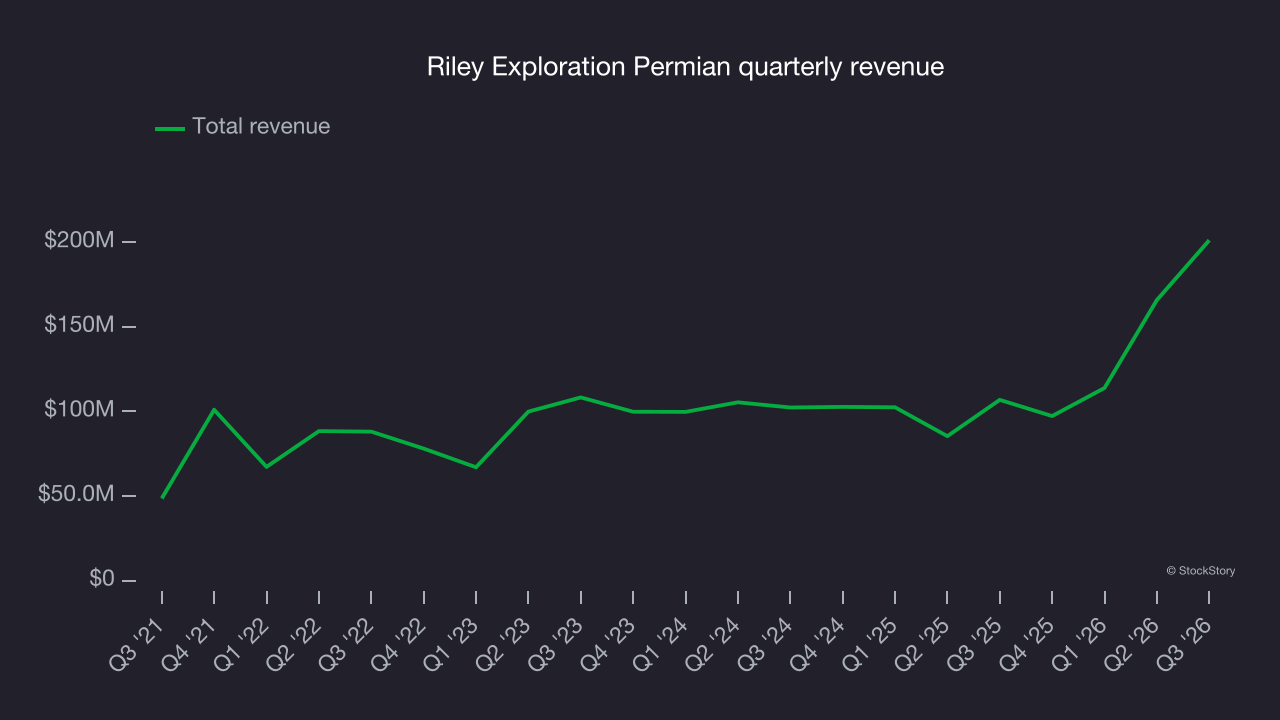
Within energy, a single time frame, even a long one, only sheds light on how well a company rode the last commodity cycle. To better assess whether a company compounds through cycles, it helps to take an even longer, ten-year view. Riley Exploration Permian’s annualized revenue growth of 30.5% over the last eight years aligns with its five-year trend, suggesting its demand was predictably strong.
This quarter, Riley Exploration Permian reported strong year-on-year revenue growth of 88.3%, and its $201.2 million of revenue beat Wall Street’s consensus estimates by 8.8%.
Adjusted EBITDA margin
Adjusted EBITDA margin measures the operating profitability of an energy producer by removing accounting effects related to depletion and capitalized drilling costs. It reveals how much cash the asset base generates before capital structure and reinvestment requirements shape reported earnings.
Riley Exploration Permian has performed well over the last five years. It demonstrated high profitability for an upstream and integrated energy business, with an average EBITDA margin of 68.2%.
Riley Exploration Permian’s EBITDA margin decreased by 24.7 percentage points over the last year. This raises questions about the company’s expense base because its revenue growth should have given it leverage on its fixed costs, resulting in better economies of scale and profitability.
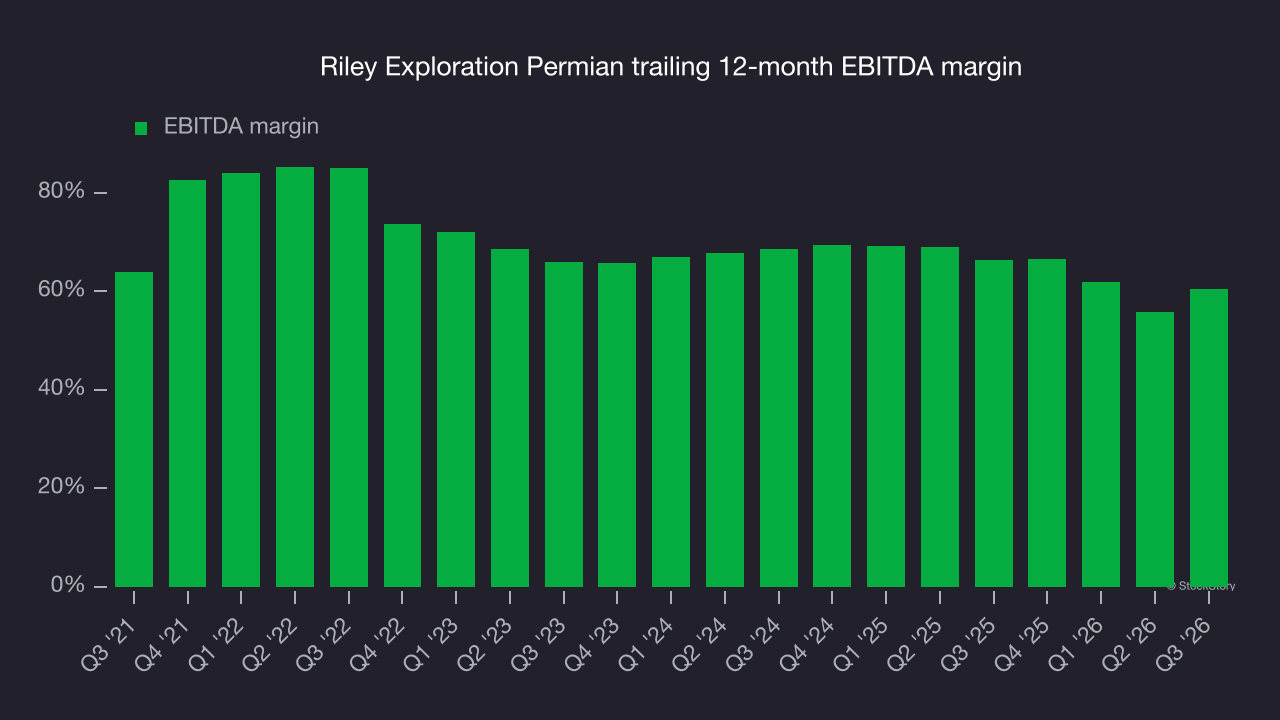
In Q3, Riley Exploration Permian generated an EBITDA margin of 71.3%, up 11.3 percentage points year on year. The increase was a positive development, indicating improved efficiency. Adjusted EBITDA beat Wall Street’s consensus estimates by 33.3%.
Free cash flow
Adjusted EBITDA shows how profitable a company’s existing “rock” is before financing and reinvestment, while free cash flow shows how much value remains after paying to replace those wells. Because production declines over time, strong EBITDA can coexist with weak free cash flow if drilling is expensive or declines are steep. Free cash flow therefore captures both operating efficiency and the cost of sustaining production.
Riley Exploration Permian has shown strong cash profitability, driven by its attractive business model that enables it to reinvest or return capital to investors. The company’s free cash flow margin averaged 16.6% over the last five years, an impressive level for an upstream and integrated energy business.
While the level of free cash flow margins is important, their consistency matters just as much.
Riley Exploration Permian’s ratio of quarterly free cash flow volatility to volatility in West Texas Intermediate, or WTI, crude prices over the past five years was 8.7 (lower is better), indicating reasonable insulation from commodity swings.
Why assess stability against commodity prices at the free cash flow line? Why not compare revenue or EBITDA to WTI in the case of Riley Exploration Permian? Because what ultimately matters is not how much revenue or profit a company earns when prices are high but how much cash it can generate when prices are low. Free cash flow is the superior metric because it includes everything from hedging effectiveness to growth and maintenance capex to management behavior during good times and bad.
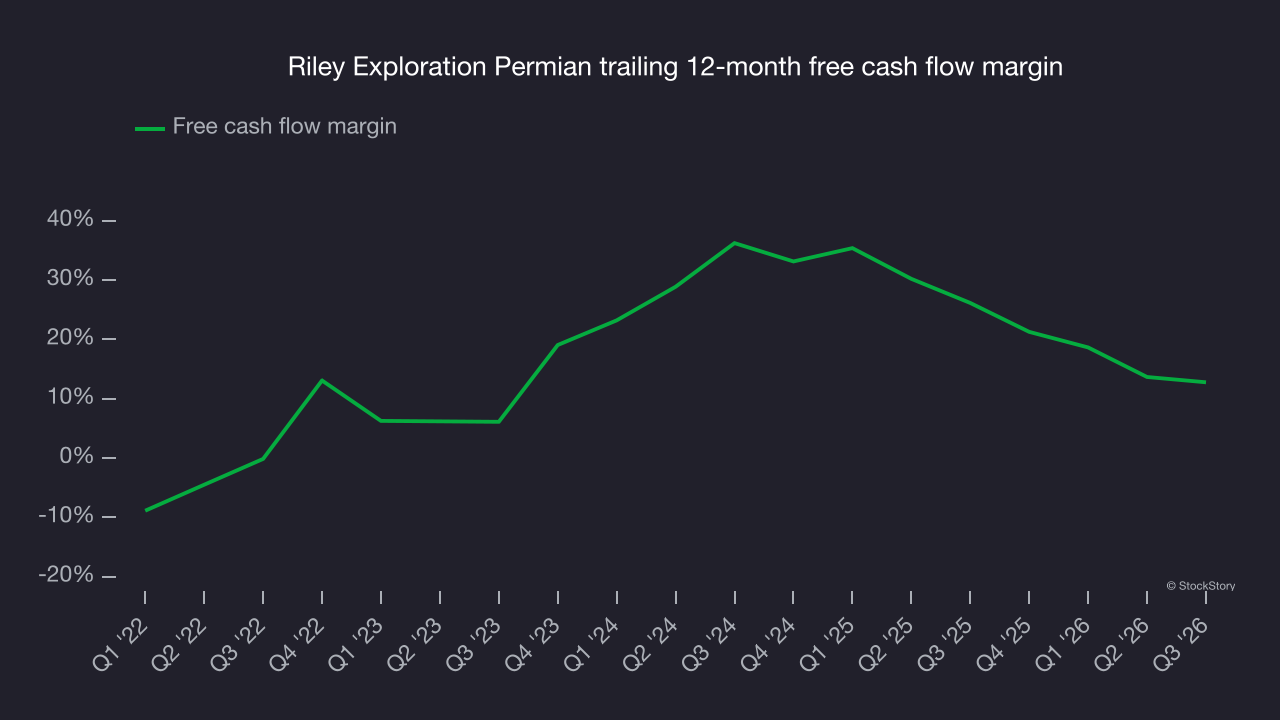
Riley Exploration Permian’s free cash flow came in at $42.35 million in Q3, equivalent to a 21% margin. The company’s cash profitability declined, with its margin 11.4 percentage points lower than in the same quarter last year, but still above its five-year average. This quarter’s decline should be viewed in context because investment needs can be seasonal, leading to short-term swings. Long-term trends carry greater meaning.
Key takeaways from Riley Exploration Permian’s Q3 results
Riley Exploration Permian’s sizable revenue beat was a positive in a softer quarter overall, as EPS missed consensus estimates. Revenue came in well ahead of analysts’ consensus expectations. Shares edged lower 1.5% to $42.04 immediately after the report.
Riley Exploration Permian’s latest quarter was underwhelming. One earnings report doesn’t define a company’s quality, though, so let’s explore whether the stock is a buy at the current price. When making that decision, it’s important to consider its valuation, business quality and latest quarterly results. For more, read our full research report here (it’s free).
If you believe this article contains misleading, harmful, or spam content, please let us know.
Report this articleMore News
View More




Recent Quotes
View MoreQuotes delayed at least 20 minutes.
By accessing this page, you agree to the Privacy Policy and Terms Of Service.