


Financial News
AGCO Corporation (NYSE:AGCO) Misses Q4 Revenue Estimates

Agricultural and farm machinery company AGCO (NYSE: AGCO) missed Wall Street’s revenue expectations in Q4 CY2024, with sales falling 24% year on year to $2.89 billion. On the other hand, the company’s outlook for the full year was close to analysts’ estimates with revenue guided to $9.6 billion at the midpoint. Its GAAP loss of $3.42 per share was significantly below analysts’ consensus estimates.
Is now the time to buy AGCO Corporation? Find out by accessing our full research report, it’s free.
AGCO Corporation (AGCO) Q4 CY2024 Highlights:
- Revenue: $2.89 billion vs analyst estimates of $3.15 billion (24% year-on-year decline, 8.5% miss)
- EPS (GAAP): -$3.42 vs analyst estimates of $1.89 (EPS would've been $1.97 if not for a $354 million goodwill impairment charge)
- Management’s revenue guidance for the upcoming financial year 2025 is $9.6 billion at the midpoint, in line with analyst expectations and implying -17.7% growth (vs -19% in FY2024)
- EPS (GAAP) guidance for the upcoming financial year 2025 is $4.25 at the midpoint, beating analyst estimates by 8.4%
- Operating Margin: -9.3%, down from 10.3% in the same quarter last year (+9.9% margin this quarter excluding the impairment charge)
- Free Cash Flow Margin: 23.7%, up from 19.5% in the same quarter last year
- Market Capitalization: $7.71 billion
"AGCO delivered strong fourth quarter results with an adjusted operating margin of 9.9%, even with challenging market dynamics and aggressive production cuts," said Eric Hansotia, AGCO's Chairman, President and Chief Executive Officer.
Company Overview
With a history that features both organic growth and acquisitions, AGCO (NYSE: AGCO) designs, manufactures, and sells agricultural machinery and related technology.
Agricultural Machinery
Agricultural machinery companies are investing to develop and produce more precise machinery, automated systems, and connected equipment that collects analyzable data to help farmers and other customers improve yields and increase efficiency. On the other hand, agriculture is seasonal and natural disasters or bad weather can impact the entire industry. Additionally, macroeconomic factors such as commodity prices or changes in interest rates–which dictate the willingness of these companies or their customers to invest–can impact demand for agricultural machinery.
Sales Growth
A company’s long-term sales performance can indicate its overall quality. Any business can put up a good quarter or two, but many enduring ones grow for years. Over the last five years, AGCO Corporation grew its sales at a tepid 5.2% compounded annual growth rate. This fell short of our benchmark for the industrials sector and is a rough starting point for our analysis.
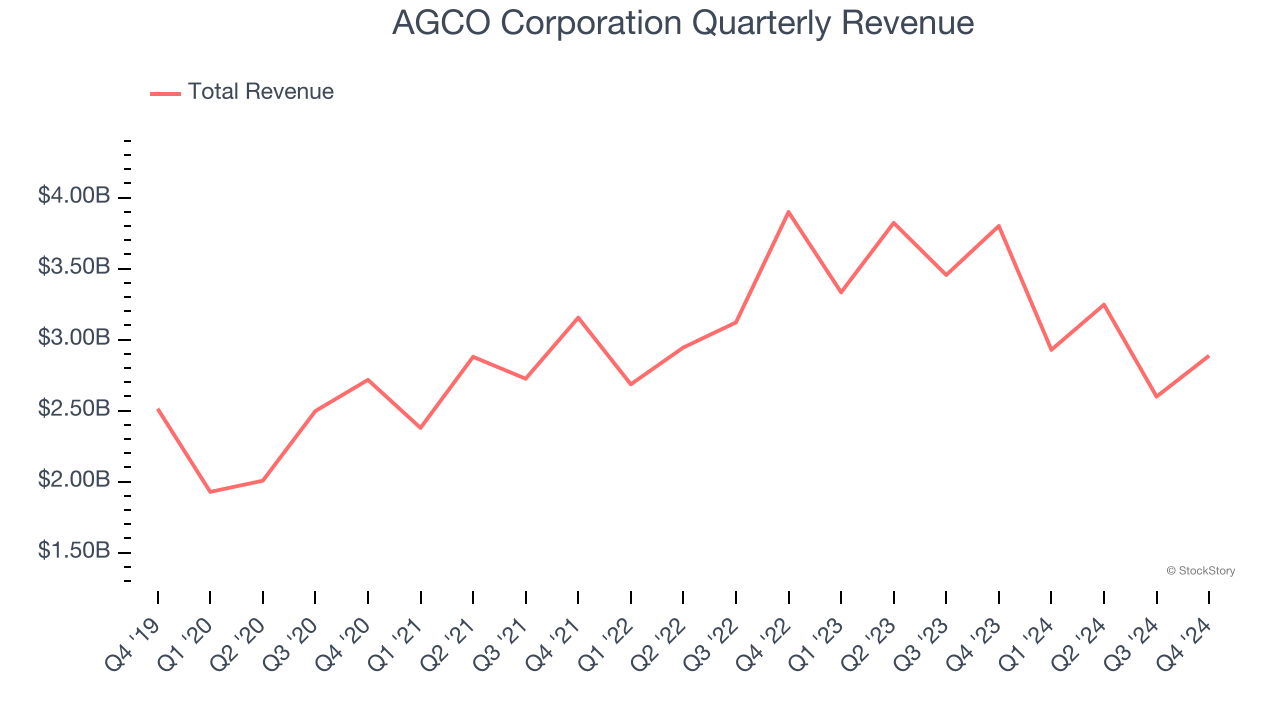
Long-term growth is the most important, but within industrials, a half-decade historical view may miss new industry trends or demand cycles. AGCO Corporation’s history shows it grew in the past but relinquished its gains over the last two years, as its revenue fell by 4% annually. 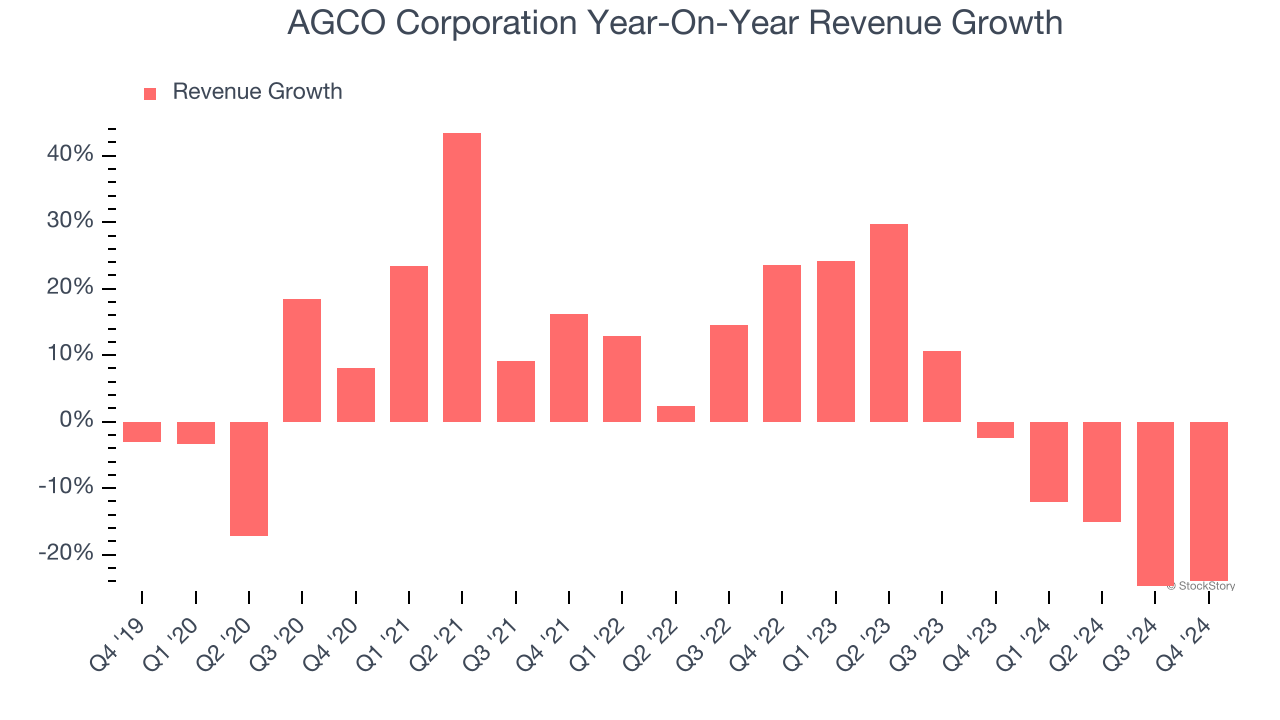
This quarter, AGCO Corporation missed Wall Street’s estimates and reported a rather uninspiring 24% year-on-year revenue decline, generating $2.89 billion of revenue.
Looking ahead, sell-side analysts expect revenue to decline by 17.5% over the next 12 months, a deceleration versus the last two years. This projection doesn't excite us and suggests its products and services will face some demand challenges.
Software is eating the world and there is virtually no industry left that has been untouched by it. That drives increasing demand for tools helping software developers do their jobs, whether it be monitoring critical cloud infrastructure, integrating audio and video functionality, or ensuring smooth content streaming. Click here to access a free report on our 3 favorite stocks to play this generational megatrend.
Operating Margin
AGCO Corporation was profitable over the last five years but held back by its large cost base. Its average operating margin of 7.5% was weak for an industrials business. This result isn’t too surprising given its low gross margin as a starting point.
Looking at the trend in its profitability, AGCO Corporation’s operating margin decreased by 7.6 percentage points over the last five years. The company’s performance was poor no matter how you look at it - it shows operating expenses were rising and it couldn’t pass those costs onto its customers.
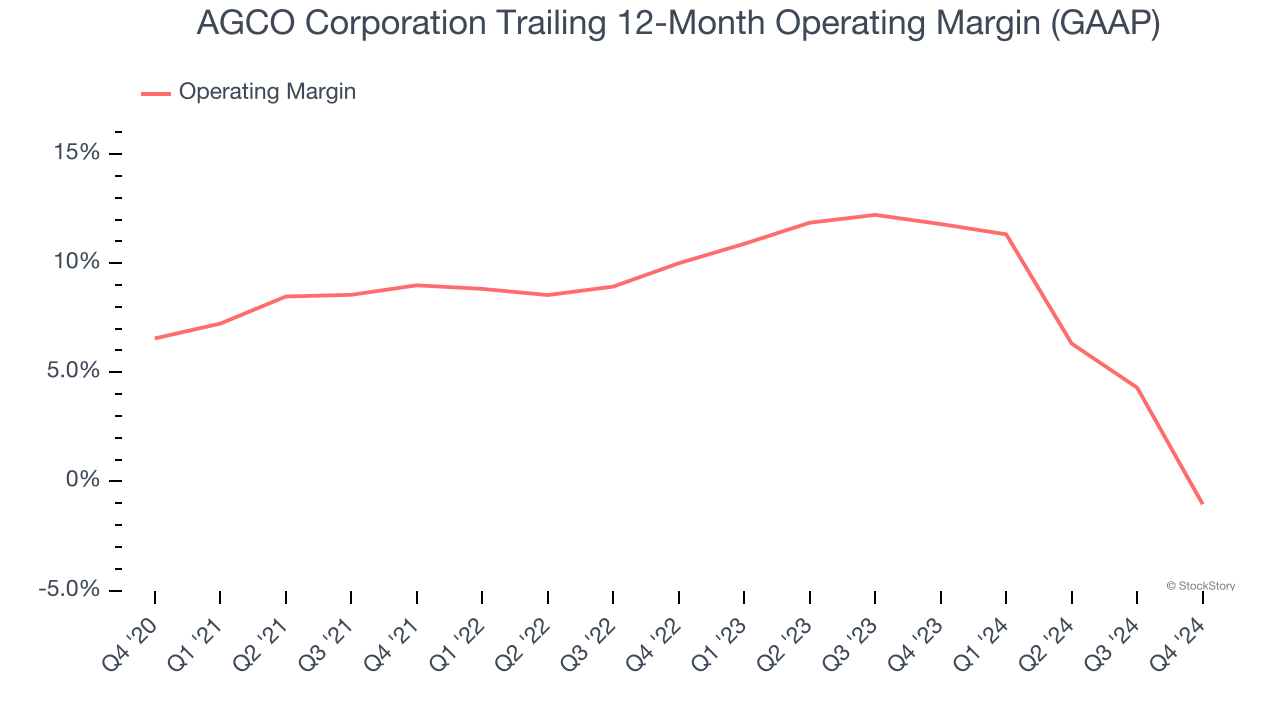
In Q4, AGCO Corporation generated an operating profit margin of negative 9.3%, down 19.7 percentage points year on year. Since AGCO Corporation’s operating margin decreased more than its gross margin, we can assume it was recently less efficient because expenses such as marketing, R&D, and administrative overhead increased.
Earnings Per Share
We track the long-term change in earnings per share (EPS) for the same reason as long-term revenue growth. Compared to revenue, however, EPS highlights whether a company’s growth is profitable.
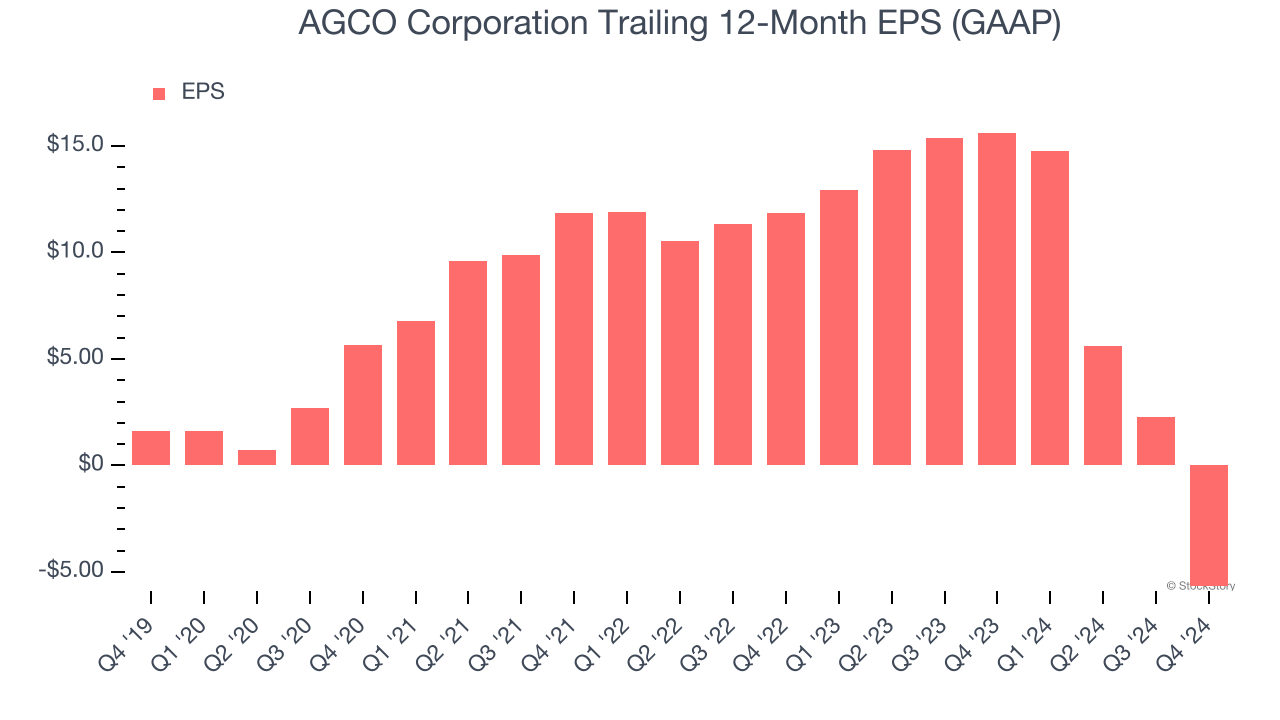
Sadly for AGCO Corporation, its EPS declined by 40.8% annually over the last five years while its revenue grew by 5.2%. This tells us the company became less profitable on a per-share basis as it expanded due to non-fundamental factors such as interest expenses and taxes.
We can take a deeper look into AGCO Corporation’s earnings to better understand the drivers of its performance. As we mentioned earlier, AGCO Corporation’s operating margin declined by 7.6 percentage points over the last five years. This was the most relevant factor (aside from the revenue impact) behind its lower earnings; taxes and interest expenses can also affect EPS but don’t tell us as much about a company’s fundamentals.
Like with revenue, we analyze EPS over a shorter period to see if we are missing a change in the business.
For AGCO Corporation, its two-year annual EPS declines of 57.4% show it’s continued to underperform. These results were bad no matter how you slice the data.
In Q4, AGCO Corporation reported EPS at negative $3.42, down from $4.53 in the same quarter last year. This print missed analysts’ estimates. Over the next 12 months, Wall Street is optimistic. Analysts forecast AGCO Corporation’s full-year EPS of negative $5.68 will flip to positive $3.71.
Key Takeaways from AGCO Corporation’s Q4 Results
We were impressed by AGCO Corporation’s optimistic full-year EPS guidance, which beat past analysts’ expectations. On the other hand, its revenue missed significantly and its EPS fell short of Wall Street’s estimates due to a $354 million goodwill impairment charge. Overall, this quarter could have been better. The stock traded down 3.7% to $99.70 immediately after reporting.
AGCO Corporation’s earnings report left more to be desired. Let’s look forward to see if this quarter has created an opportunity to buy the stock. If you’re making that decision, you should consider the bigger picture of valuation, business qualities, as well as the latest earnings. We cover that in our actionable full research report which you can read here, it’s free.
More News
View More


Recent Quotes
View MoreQuotes delayed at least 20 minutes.
By accessing this page, you agree to the Privacy Policy and Terms Of Service.