


Financial News
Albany (NYSE:AIN) Misses Q3 Sales Expectations

Industrial equipment and engineered products manufacturer Albany (NYSE: AIN) missed Wall Street’s revenue expectations in Q3 CY2025, with sales falling 12.4% year on year to $261.4 million. Its non-GAAP profit of $0.71 per share was 2.6% below analysts’ consensus estimates.
Is now the time to buy Albany? Find out by accessing our full research report, it’s free for active Edge members.
Albany (AIN) Q3 CY2025 Highlights:
- Revenue: $261.4 million vs analyst estimates of $299.8 million (12.4% year-on-year decline, 12.8% miss)
- Adjusted EPS: $0.71 vs analyst expectations of $0.73 (2.6% miss)
- Adjusted EBITDA: $56.17 million vs analyst estimates of $62.53 million (21.5% margin, 10.2% miss)
- Operating Margin: -44.6%, down from 8.4% in the same quarter last year
- Free Cash Flow Margin: 9.9%, similar to the same quarter last year
- Market Capitalization: $1.62 billion
Gunnar Kleveland, Albany International’s President and Chief Executive Officer said, “As announced last week, we are continuing the transformation of Albany International and have initiated a strategic review of our structures assembly business and its associated production site in Salt Lake City, including a potential sale of all or part of the site. Alongside this effort we took decisive action to de-risk our program assumptions which marks an important first step in resolving the issue. While some near-term uncertainty remains, our remaining Aerospace portfolio is becoming more strategically aligned with our priorities to secure growth and new business where we have a distinct competitive advantage that leverages our differentiated advanced technologies and delivers greater returns.”
Company Overview
Founded in 1895, Albany (NYSE: AIN) is a global textiles and materials processing company, specializing in machine clothing for paper mills and engineered composite structures for aerospace and other industries.
Revenue Growth
A company’s long-term sales performance is one signal of its overall quality. Any business can put up a good quarter or two, but many enduring ones grow for years. Regrettably, Albany’s sales grew at a sluggish 4.3% compounded annual growth rate over the last five years. This was below our standard for the industrials sector and is a tough starting point for our analysis.
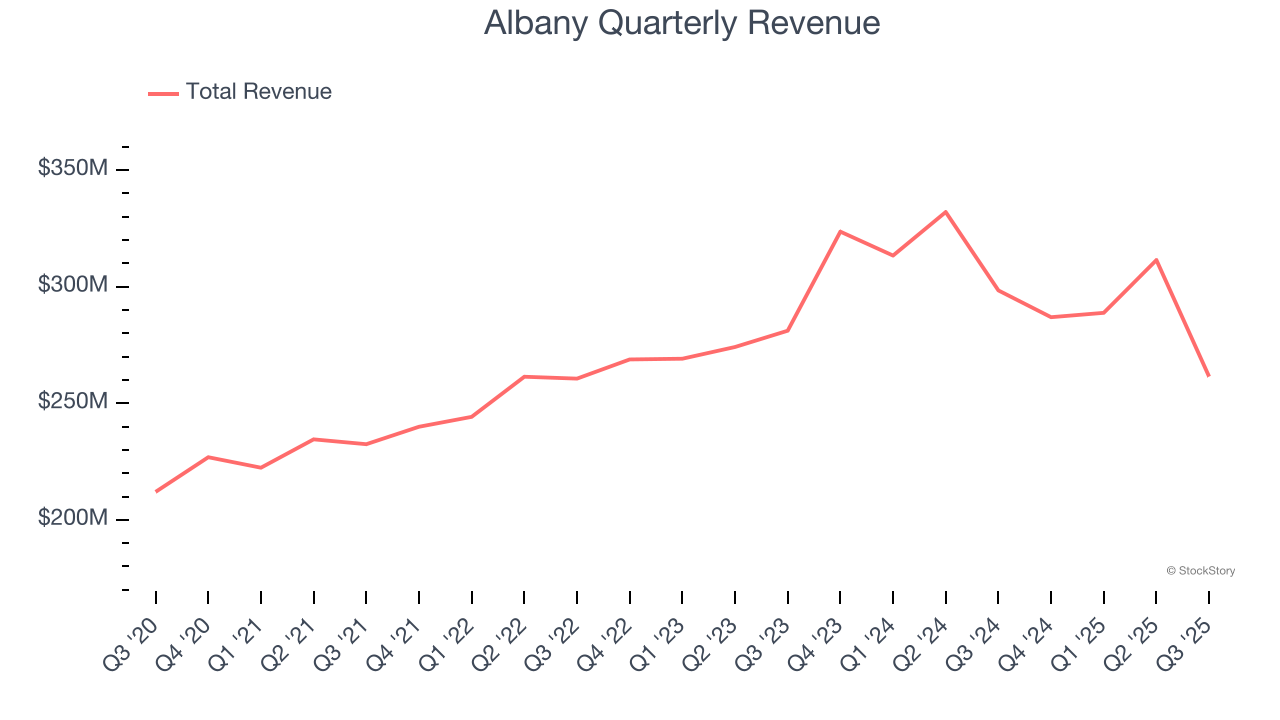
We at StockStory place the most emphasis on long-term growth, but within industrials, a half-decade historical view may miss cycles, industry trends, or a company capitalizing on catalysts such as a new contract win or a successful product line. Albany’s recent performance shows its demand has slowed as its annualized revenue growth of 2.5% over the last two years was below its five-year trend. 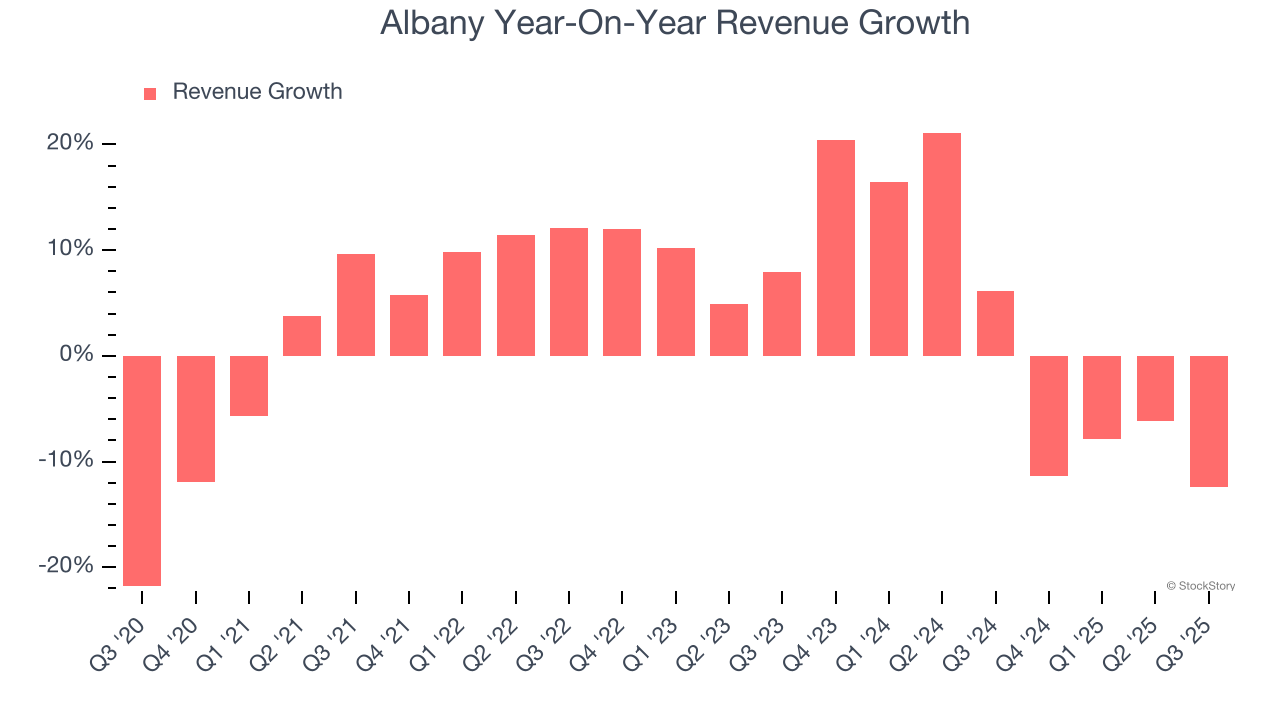
We can dig further into the company’s revenue dynamics by analyzing its most important segments, Machine Clothing and Engineered Composites, which are 66.9% and 33.1% of revenue. Over the last two years, Albany’s Machine Clothing revenue (paper manufacturing belts) averaged 7.7% year-on-year growth. On the other hand, its Engineered Composites revenue (aerospace components) averaged 3% declines. 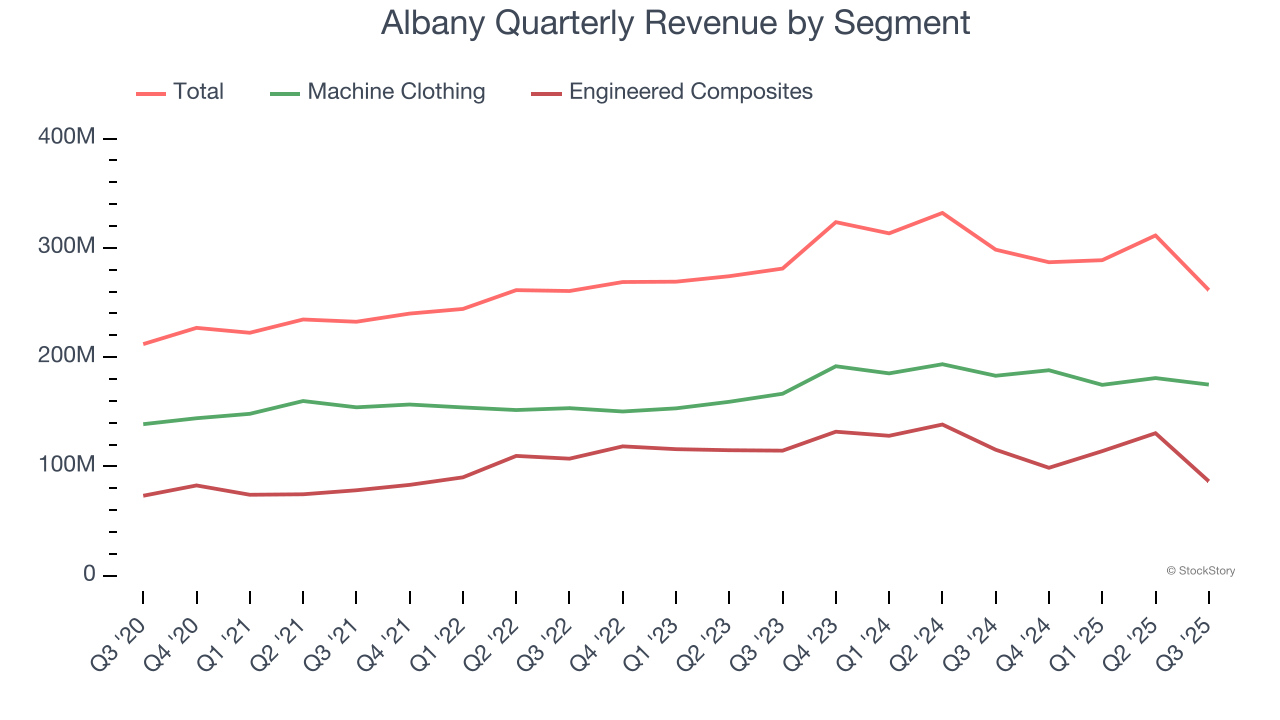
This quarter, Albany missed Wall Street’s estimates and reported a rather uninspiring 12.4% year-on-year revenue decline, generating $261.4 million of revenue.
Looking ahead, sell-side analysts expect revenue to grow 6.6% over the next 12 months. Although this projection suggests its newer products and services will catalyze better top-line performance, it is still below the sector average.
Microsoft, Alphabet, Coca-Cola, Monster Beverage—all began as under-the-radar growth stories riding a massive trend. We’ve identified the next one: a profitable AI semiconductor play Wall Street is still overlooking. Go here for access to our full report.
Operating Margin
Operating margin is a key measure of profitability. Think of it as net income - the bottom line - excluding the impact of taxes and interest on debt, which are less connected to business fundamentals.
Albany has managed its cost base well over the last five years. It demonstrated solid profitability for an industrials business, producing an average operating margin of 11.6%. This result isn’t too surprising as its gross margin gives it a favorable starting point.
Analyzing the trend in its profitability, Albany’s operating margin decreased by 22.3 percentage points over the last five years. This raises questions about the company’s expense base because its revenue growth should have given it leverage on its fixed costs, resulting in better economies of scale and profitability.
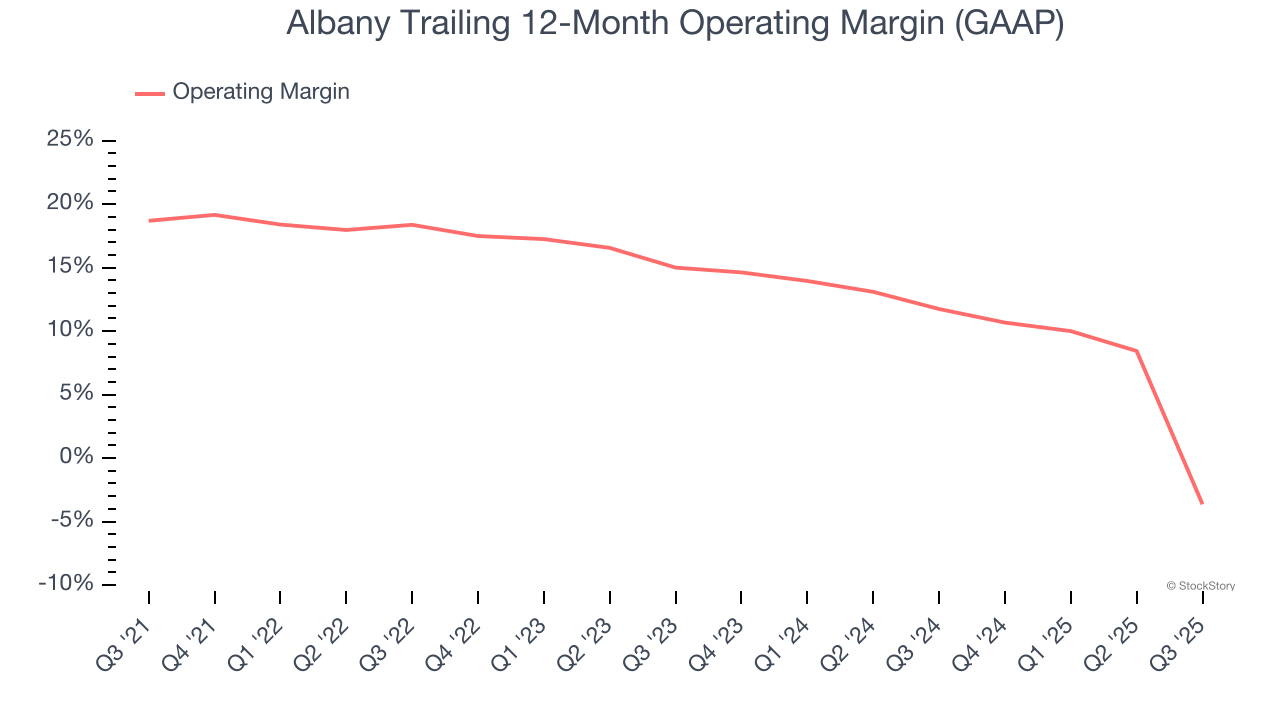
This quarter, Albany generated an operating margin profit margin of negative 44.6%, down 53 percentage points year on year. Since Albany’s operating margin decreased more than its gross margin, we can assume it was less efficient because expenses such as marketing, R&D, and administrative overhead increased.
Earnings Per Share
Revenue trends explain a company’s historical growth, but the long-term change in earnings per share (EPS) points to the profitability of that growth – for example, a company could inflate its sales through excessive spending on advertising and promotions.
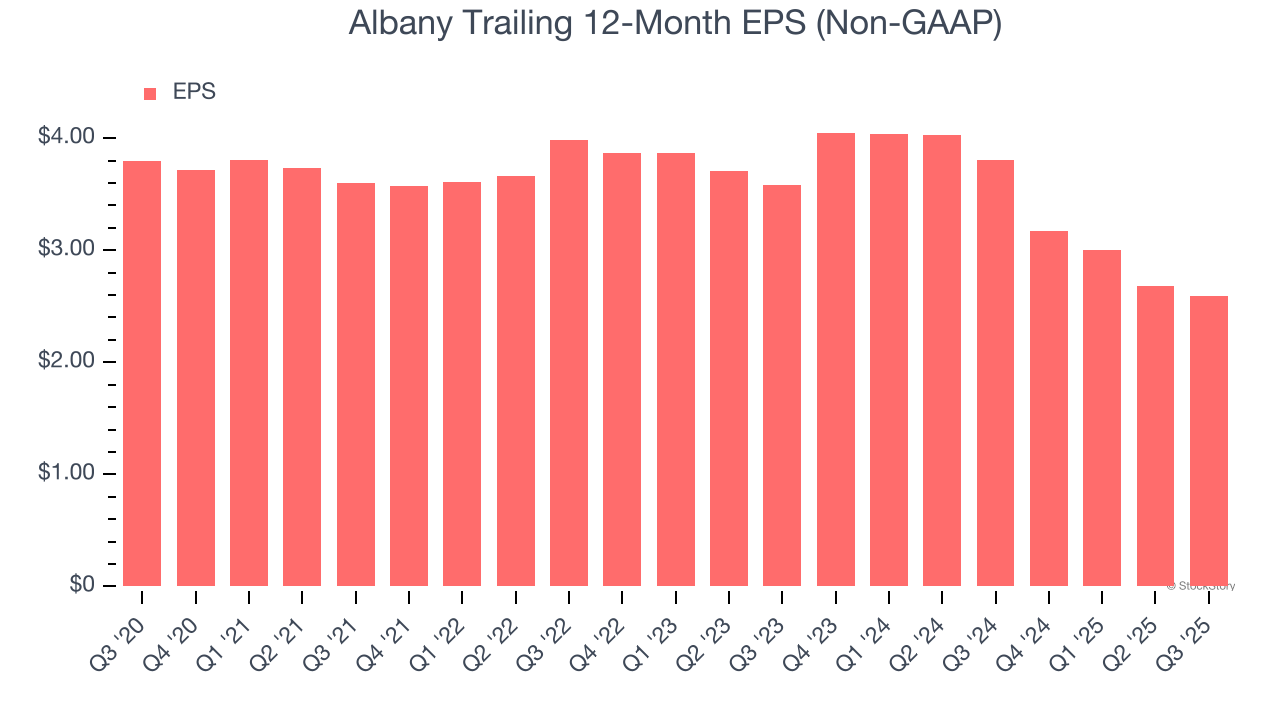
Sadly for Albany, its EPS declined by 7.4% annually over the last five years while its revenue grew by 4.3%. This tells us the company became less profitable on a per-share basis as it expanded due to non-fundamental factors such as interest expenses and taxes.
We can take a deeper look into Albany’s earnings to better understand the drivers of its performance. As we mentioned earlier, Albany’s operating margin declined by 22.3 percentage points over the last five years. This was the most relevant factor (aside from the revenue impact) behind its lower earnings; interest expenses and taxes can also affect EPS but don’t tell us as much about a company’s fundamentals.
Like with revenue, we analyze EPS over a shorter period to see if we are missing a change in the business.
For Albany, its two-year annual EPS declines of 14.9% show it’s continued to underperform. These results were bad no matter how you slice the data.
In Q3, Albany reported adjusted EPS of $0.71, down from $0.80 in the same quarter last year. This print missed analysts’ estimates. Over the next 12 months, Wall Street expects Albany’s full-year EPS of $2.59 to grow 29.1%.
Key Takeaways from Albany’s Q3 Results
We struggled to find many positives in these results. Its Engineered Composites revenue missed and its revenue fell short of Wall Street’s estimates. Overall, this quarter could have been better. The stock traded down 1.8% to $53.62 immediately following the results.
Albany didn’t show it’s best hand this quarter, but does that create an opportunity to buy the stock right now? When making that decision, it’s important to consider its valuation, business qualities, as well as what has happened in the latest quarter. We cover that in our actionable full research report which you can read here, it’s free for active Edge members.
More News
View More


Recent Quotes
View MoreQuotes delayed at least 20 minutes.
By accessing this page, you agree to the Privacy Policy and Terms Of Service.