Financial News
Hayward’s (NYSE:HAYW) Q3 Sales Top Estimates, Provides Encouraging Full-Year Guidance

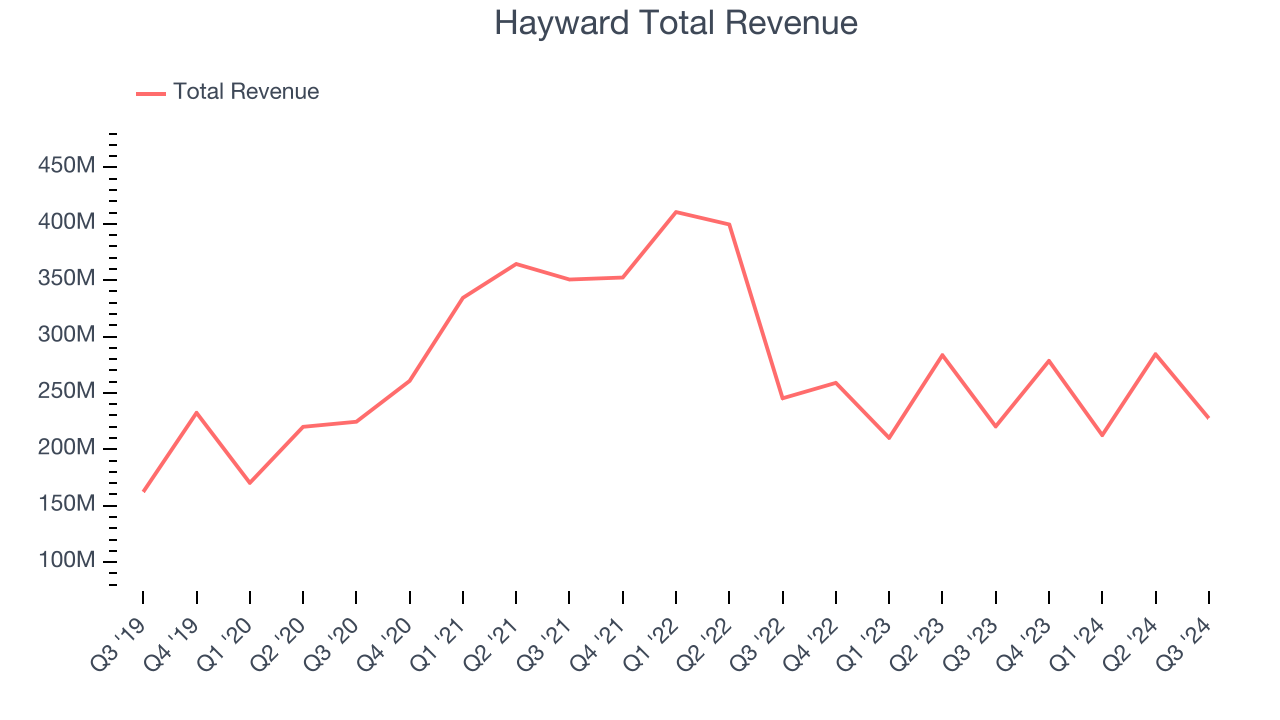
Pool equipment and automation systems manufacturer Hayward Holdings (NYSE: HAYW) reported revenue ahead of Wall Street’s expectations in Q3 CY2024, with sales up 3.3% year on year to $227.6 million. The company’s full-year revenue guidance of $1.03 billion at the midpoint also came in slightly above analysts’ estimates. Its non-GAAP profit of $0.11 per share was also 10.2% above analysts’ consensus estimates.
Is now the time to buy Hayward? Find out by accessing our full research report, it’s free.
Hayward (HAYW) Q3 CY2024 Highlights:
- Revenue: $227.6 million vs analyst estimates of $222.9 million (2.1% beat)
- Adjusted EPS: $0.11 vs analyst estimates of $0.10 (10.2% beat)
- EBITDA: $51.09 million vs analyst estimates of $47.64 million (7.2% beat)
- The company slightly lifted its revenue guidance for the full year to $1.03 billion at the midpoint from $1.03 billion
- EBITDA guidance for the full year is $265 million at the midpoint , above analyst estimates of $260.6 million
- Gross Margin (GAAP): 49.7%, up from 47.8% in the same quarter last year
- Operating Margin: 14.7%, up from 13.1% in the same quarter last year
- EBITDA Margin: 22.5%, up from 21.4% in the same quarter last year
- Free Cash Flow Margin: 26%, up from 19.7% in the same quarter last year
- Market Capitalization: $3.18 billion
“I am pleased to report third quarter results consistent with expectations”Post this CEO COMMENTS
Company Overview
Credited with introducing the first variable-speed pool pump, Hayward (NYSE: HAYW) makes residential and commercial pool equipment and accessories.
Home Construction Materials
Traditionally, home construction materials companies have built economic moats with expertise in specialized areas, brand recognition, and strong relationships with contractors. More recently, advances to address labor availability and job site productivity have spurred innovation that is driving incremental demand. However, these companies are at the whim of residential construction volumes, which tend to be cyclical and can be impacted heavily by economic factors such as interest rates. Additionally, the costs of raw materials can be driven by a myriad of worldwide factors and greatly influence the profitability of home construction materials companies.
Sales Growth
A company’s long-term performance is an indicator of its overall business quality. While any business can experience short-term success, top-performing ones enjoy sustained growth for multiple years. Luckily, Hayward’s sales grew at a decent 7.7% compounded annual growth rate over the last five years. This is a useful starting point for our analysis.

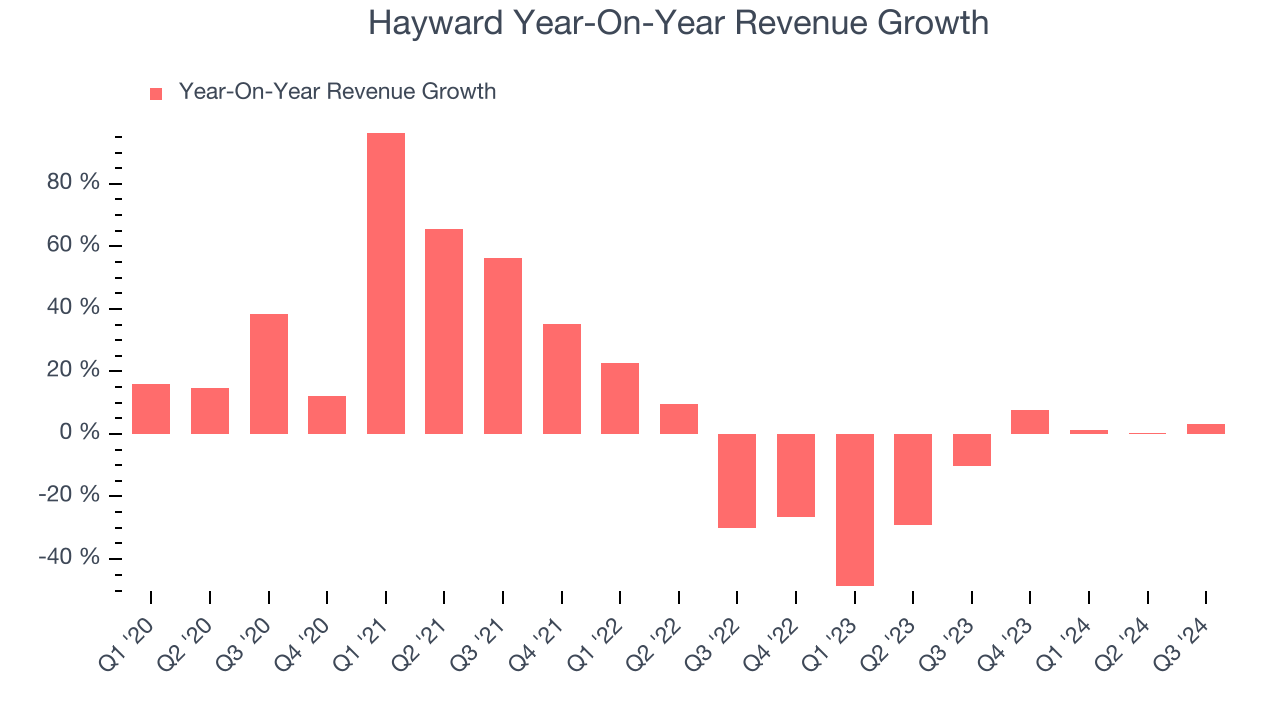
Long-term growth is the most important, but within industrials, a half-decade historical view may miss new industry trends or demand cycles. Hayward’s recent history marks a sharp pivot from its five-year trend as its revenue has shown annualized declines of 15.6% over the last two years. 
This quarter, Hayward reported modest year-on-year revenue growth of 3.3% but beat Wall Street’s estimates by 2.1%.
Looking ahead, sell-side analysts expect revenue to grow 6.7% over the next 12 months. While this projection indicates the market thinks its newer products and services will spur better performance, it is still below the sector average.
Here at StockStory, we certainly understand the potential of thematic investing. Diverse winners from Microsoft (MSFT) to Alphabet (GOOG), Coca-Cola (KO) to Monster Beverage (MNST) could all have been identified as promising growth stories with a megatrend driving the growth. So, in that spirit, we’ve identified a relatively under-the-radar profitable growth stock benefitting from the rise of AI, available to you FREE via this link.
Operating Margin
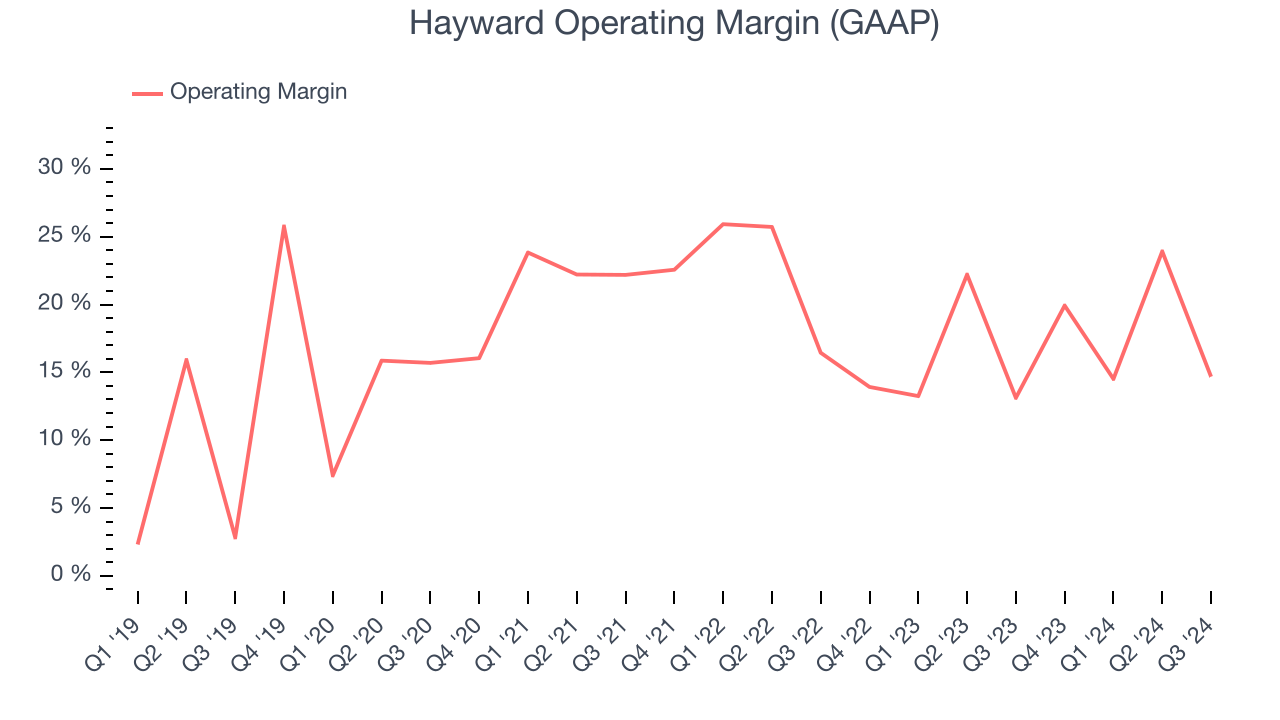
Hayward has been a well-oiled machine over the last five years. It demonstrated elite profitability for an industrials business, boasting an average operating margin of 19.8%. This result isn’t surprising as its high gross margin gives it a favorable starting point.
Looking at the trend in its profitability, Hayward’s annual operating margin rose by 1.9 percentage points over the last five years, showing its efficiency has improved.

This quarter, Hayward generated an operating profit margin of 14.7%, up 1.6 percentage points year on year. Since its gross margin expanded more than its operating margin, we can infer that leverage on its cost of sales was the primary driver behind the recently higher efficiency.
Earnings Per Share
We track the long-term change in earnings per share (EPS) for the same reason as long-term revenue growth. Compared to revenue, however, EPS highlights whether a company’s growth was profitable.
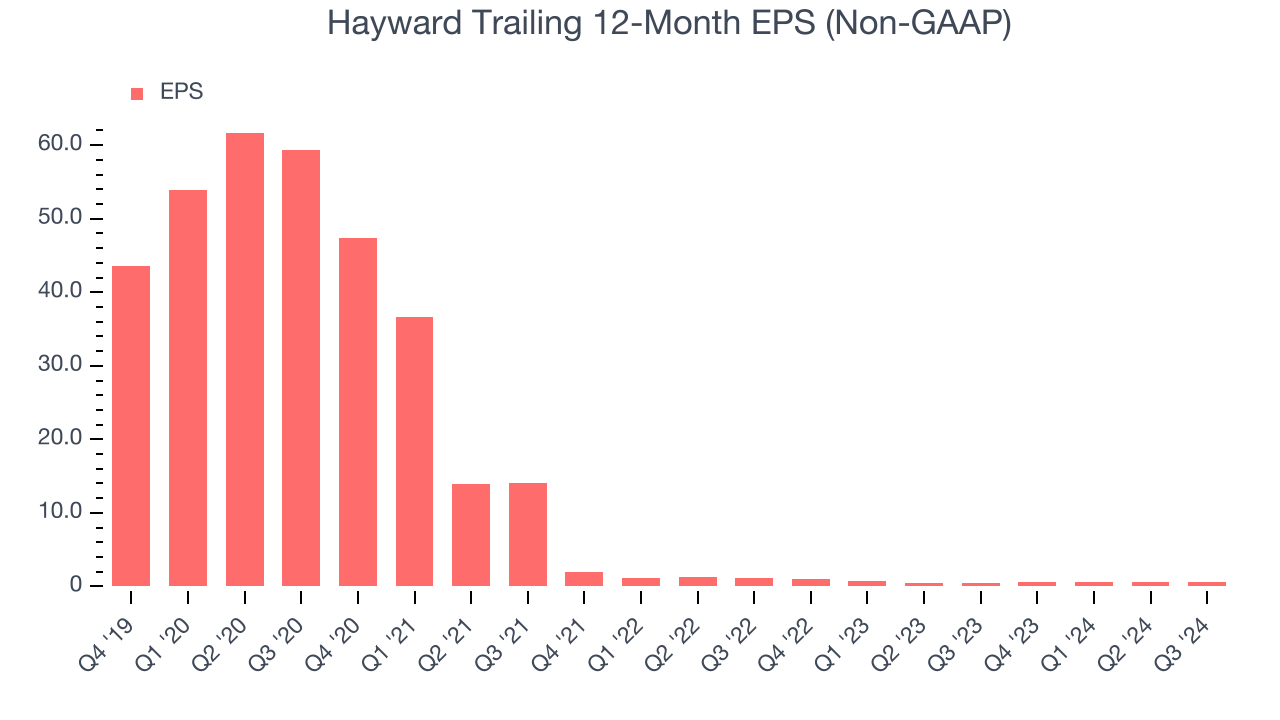
Sadly for Hayward, its EPS declined by 54% annually over the last five years while its revenue grew by 7.7%. However, its operating margin actually expanded during this timeframe, telling us that non-fundamental factors affected its ultimate earnings.

Like with revenue, we analyze EPS over a more recent period because it can give insight into an emerging theme or development for the business. Hayward’s two-year annual EPS declines of 27.6% were bad and lower than its two-year revenue performance.
In Q3, Hayward reported EPS at $0.11, up from $0.09 in the same quarter last year. This print easily cleared analysts’ estimates, and shareholders should be content with the results. Over the next 12 months, Wall Street expects Hayward’s full-year EPS of $0.60 to grow by 20.8%.
Key Takeaways from Hayward’s Q3 Results
We were impressed by how significantly Hayward blew past analysts’ revenue and EBITDA expectations this quarter. We were also excited it lifted its full-year revenue and EBITDA guidance. Zooming out, we think this "beat and raise" quarter featured some important positives. The stock traded up 3.2% to $15.25 immediately following the results.
Indeed, Hayward had a rock-solid quarterly earnings result, but is this stock a good investment here?We think that the latest quarter is only one piece of the longer-term business quality puzzle. Quality, when combined with valuation, can help determine if the stock is a buy. We cover that in our actionable full research report which you can read here, it’s free.
More News
View More


Recent Quotes
View MoreQuotes delayed at least 20 minutes.
By accessing this page, you agree to the Privacy Policy and Terms Of Service.


