



Financial News
Optimal Blue report: Non-QM bucks September slowdown as mortgage rates surge
News Source: Optimal Blue
Purchase holds near year-ago levels as non-QM share climbs to 12%
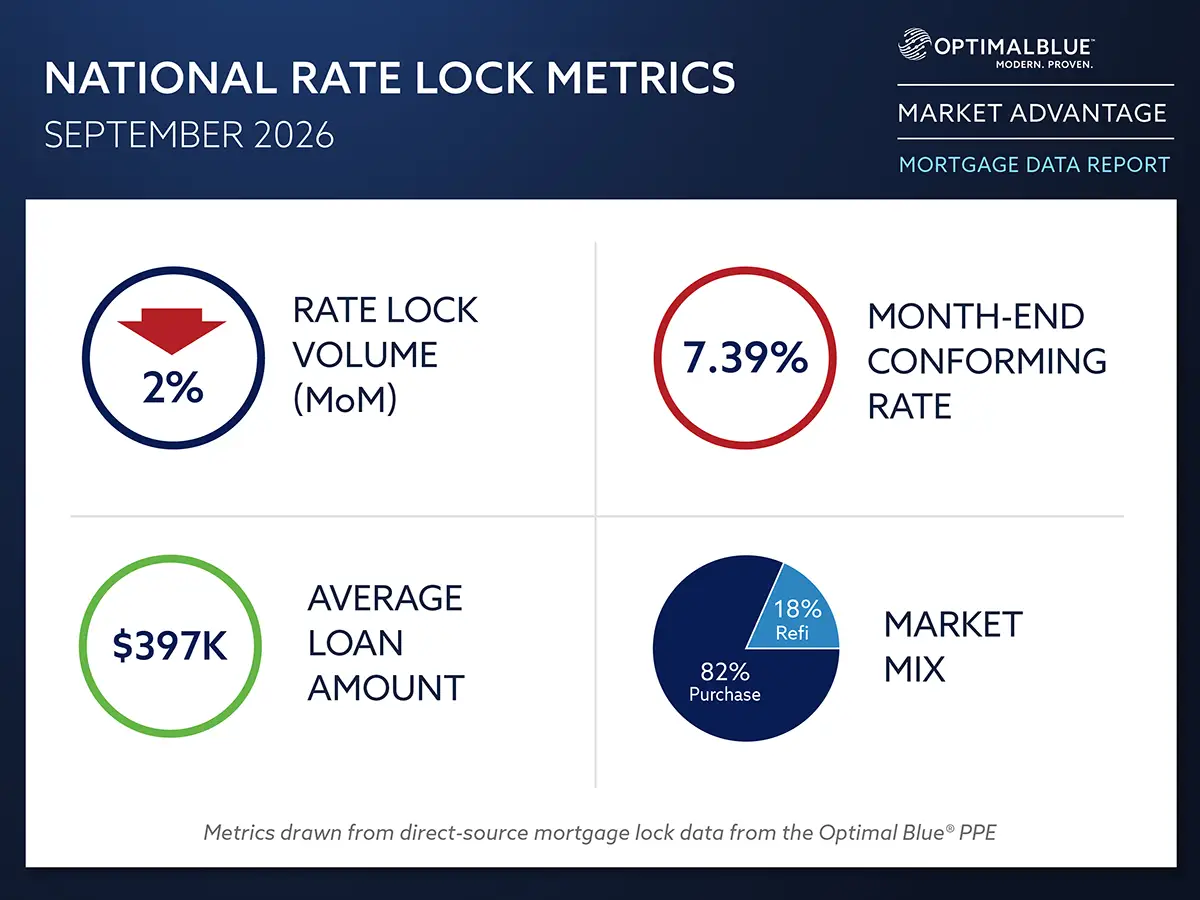
PLANO, Texas, Oct. 13, 2026 (SEND2PRESS NEWSWIRE) — Optimal Blue today released its September 2026 Market Advantage mortgage data report, which found non-qualified mortgage (non-QM) lending continued to expand even as rising rates weighed on broader mortgage activity. Total rate-lock volume declined 2% month over month (MoM), 21% over the past three months and 26% year over year (YoY). Non-QM lock volume bucked the broader decline, rising 8% MoM as non-QM loans accounted for 12% of September production.
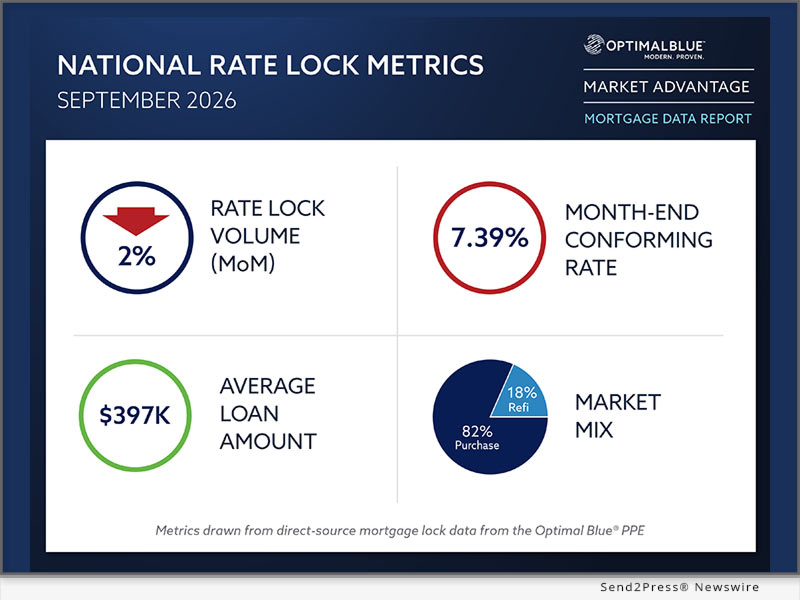
IMAGE caption: Optimal Blue’s September 2026 Market Advantage mortgage data report.
Purchase volume proved comparatively resilient, declining less than 1% both MoM and YoY while accounting for 82% of September locks. Refinance fell to 18% of total production. Adjustable-rate mortgage (ARM) share climbed to 14% of total lock volume, the highest level in Market Advantage data going back to 2019.
Mortgage rates moved higher across all major products in September. The Optimal Blue Mortgage Market Indices (OBMMI) 30-year conforming fixed rate, the benchmark for CME Group’s Mortgage Rate futures, ended September at 7.39%, up 67 basis points (bps) during the month, 93 bps over the past three months and 107 bps YoY. The OBMMI 30-year jumbo rate ended the month at 7.36%, with Federal Housing Administration (FHA) loans at 7.10% and U.S. Department of Veterans Affairs (VA) loans at 7.08%. The 10-year Treasury finished September at 5.29%, an increase of 54 bps during the month and 113 bps YoY. The spread between the 10-year Treasury and the OBMMI 30-year conforming rate widened 13 bps during September to approximately 210 bps.
“What stands out in September is how much product mix is doing the work of keeping purchase activity moving,” said Brennan O’Connell, director of data solutions at Optimal Blue. “Conforming lost share while non-QM volume grew and ARM usage reached its highest level seen in our report. That tells lenders there is still purchase demand to serve, but increasingly it may not fit neatly into the traditional conforming box. In this rate environment, production opportunity is going to depend in part on how broadly lenders can meet borrowers across different credit, income and payment scenarios.”
Added O’Connell, “As we look ahead, our Virtual Economist forecasts a continued rise in rates 12-months from now. Key drivers include September’s actual rate increases, the Fed’s indication of continued rate hikes over the coming year, as well as recent upticks in GDP, the price of oil, and disposable income.”
On the secondary side, lender hedge mix shifted sharply toward higher coupons as rates moved higher. The UM30 5.5, the 5.5% coupon for 30-year uniform mortgage-backed securities (MBS), fell from 62% to 50% of hedges while the UM30 6.0 climbed to 44%. MBS execution also increased to 47% of hedged loan sales, its highest level since January 2026. Mortgage servicing rights (MSRs) for conforming 30-year loans increased just 1 bp to 1.39%, a 5.57 multiple, even as the average OBMMI 30-year conforming rate rose 32 bps during the month. The share of loans sold at the highest price tier increased to 78%.
“The rapid shift from the 5.5 to the 6.0 coupon shows how quickly lenders repositioned their hedges as rates moved higher,” said Mike Vough, Optimal Blue’s senior vice president of corporate strategy. “But not every secondary-market metric followed rates in the same direction or by the same magnitude. MSR values barely moved, servicing retention was relatively stable and execution spreads were mixed. In a market like this, capital markets teams have to pay close attention to where loans are actually slotting and how pipeline risk is changing rather than assuming the entire execution picture will move with the headline rate.”
Key findings from the Market Advantage report, derived from direct-source mortgage lock and secondary market data and Virtual Economist forward-looking forecasts, include:
VOLUME TRENDS AND MARKET COMPOSITION
- Refi pressure intensifies: Refinance share fell to 18% of total production. Cash-out refinance volume declined 8% MoM and 23% YoY, while rate-and-term refinance volume fell 13% from August and 82% YoY.
- Purchase demand holds near year-ago levels: Purchase lock volume declined less than 1% both MoM and YoY, accounting for 82% of total lock volume in September, but was down 20% over the past three months.
- Conforming share retreats: Conforming share declined 71 bps MoM to 46%, while non-conforming share increased 285 bps to nearly 24%. Compared with a year ago, conforming share was down more than 6 percentage points and non-conforming share was up nearly 7 percentage points. FHA represented 18% of production while VA accounted for 11%.
- Non-QM bucks broader decline: Non-QM lock volume increased 8% MoM even as total lock volume declined 2%. Non-QM loans accounted for 12% of September production, up 117 bps MoM, 357 bps over the past three months and 478 bps YoY. Investor and debt service coverage ratio (DSCR) loans represented 33% of non-QM activity, bank statement loans accounted for 30% and other expanded guideline programs made up the remaining 37%.
- ARM share reaches series high: Adjustable-rate mortgages reached 14% of total lock volume in September, up from 10.5% in August and the highest share in Market Advantage data going back to 2019.
- New construction activity holds steady: Single-family detached homes represented approximately 64% of production. Planned unit developments (PUDs), a proxy for new-construction activity, accounted for 28% of volume, down modestly MoM but approximately 1 percentage point higher YoY. Condominiums accounted for nearly 6% of production.
RATES AND PRICING
- Treasury yields climb: The 10-year Treasury yield rose 54 bps MoM to 5.29%, up 113 bps YoY. The spread between the 10-year Treasury and the OBMMI 30-year conforming rate widened 13 bps during September to approximately 210 bps.
- Rates surge across all products: The OBMMI 30-year conforming fixed rate rose 67 bps MoM to 7.39%, up 93 bps over three months and 107 bps YoY. The OBMMI 30-year jumbo rate ended the month at 7.36%, with FHA and VA rates ending at 7.10% and 7.08%, respectively.
- MSRs edge up as rates climb: MSRs for conforming 30-year loans increased 1 bp to 1.39%, a 5.57 multiple, despite the average OBMMI 30-year conforming rate rising 32 bps during the month.
- Highest-price tier gains share: The share of loans sold at the highest price tier increased 43 bps to 78% in September. Second-ranked executions increased 120 bps to 14%, while fourth-tier or lower executions declined 189 bps to 5%.
MARKET OUTLOOK
- Rates forecast to continue climbing: The OBMMI 30-year conforming fixed rate is forecast at 7.66% over the next month, 7.80% over three months, and 7.85% over the next 12 months.
- Spread forecast to widen modestly then stabilize: The primary-secondary spread is forecast to widen from 0.95% to approximately 1.06% MoM and remain near that level over the next 12 months.
CHANNEL AND EXECUTION
- Hedge mix shifts toward higher coupons: The UM30 5.5 remained the most widely used hedging instrument at 50% of hedges but fell from 62% in August as the UM30 6.0 rose to 44%. By comparison, 25% of production priced into the 5.5 coupon and 31% into the 6.0 coupon.
- Execution spreads mixed: Best-efforts-to-mandatory spreads for conventional 30-year products were flat MoM at 26 bps. Government 30-year spreads decreased 6 bps MoM to 10 bps. Conventional 15-year spreads increased 3 bps MoM to 41 bps.
- MBS execution jumps to highest since January: The share of hedged loan sales delivered via MBS increased 385 bps to 47%, a level not seen since January 2026. Cash execution accounted for 29% and bulk execution 22%, with best-efforts at 2%.
- Spec-eligible share inches up: The share of a lender’s pipeline eligible for specified pool delivery edged up to 80.3% from 80%. The largest increase came from the share of loans originated in New York, Florida, Texas or Puerto Rico, which rose from 4.68% to 5%. The largest decrease came from the $450,000 unpaid principal balance tier, which declined from 8.32% to 8.17%.
- Servicing retention dips: The share of loans sold servicing retained declined to 56% from 57% in August.
PRODUCT MIX AND BORROWER PROFILES
- First-time buyers remain active: First-time homebuyer share was approximately 44% for conforming purchase locks, 70% for FHA and 46% for VA. FHA and VA first-time homebuyer shares increased modestly MoM while conforming share declined roughly half a percentage point.
- DTIs drift higher: Purchase debt-to-income (DTI) ratios increased slightly in September, with conforming borrowers at 37.1%, FHA borrowers at 44.0% and VA borrowers at 43.8%.
- Credit quality strengthens: The average credit score across all locks nationwide was approximately 731 in September. Purchase credit scores averaged approximately 736, cash-out refinance scores averaged approximately 698 and rate-and-term refinance scores averaged approximately 741. Average loan-to-value (LTV) remained just above 80%.
- Pull-through moves in opposite directions: Purchase pull-through declined 270 bps MoM to 82.2%, while refinance pull-through improved 181 bps MoM to 74.6%.
- Loan amounts rise: The average locked loan amount increased more than 2% from August to approximately $397,000, moving back toward the $400,000 threshold despite the decline in overall volume.
To view the full September 2026 Market Advantage report, complete the free subscription form: https://engage.optimalblue.com/market-advantage.
Subscribers receive a report PDF each month with the latest data. Members of the press are eligible for special, advance access each month and should contact Alexandra Kreuter to be added to the media list.
For more data-driven insights from Optimal Blue, clients are encouraged to register for the company’s 2027 Summit taking place Feb. 1 – 3 in Scottsdale, Ariz., and to take advantage of early bird pricing before it ends Oct. 31. Registration is open at Summit.OptimalBlue.com.
ABOUT THE MARKET ADVANTAGE DATA REPORT
Optimal Blue issues the Market Advantage mortgage data report each month to provide insight into U.S. mortgage trends and drivers of lending profitability. Data is sourced from the Optimal Blue PPE, which is used to price and lock more than one-third of all mortgages nationwide, and Optimal Blue’s hedging and loan trading system, which supports approximately 40% of loans hedged and sold into the secondary market. The report also includes forward-looking rate and spread forecasts generated by Virtual Economist, an AI- and machine learning-powered forecasting tool built on public economic data and Optimal Blue’s proprietary lock volume data. As the leader in mortgage capital markets technology, Optimal Blue has a direct view of both origination and secondary market activity and the interconnectedness of the two. Unlike self-reported survey data, Optimal Blue’s direct-source data accurately reflect the in-process loans in lenders’ pipelines and secondary market executions. Visit Optimal Blue’s website to subscribe to receive the free report each month.
Nothing herein shall be construed as, nor is Optimal Blue providing, any legal, trading, hedging or financial advice.
ABOUT OPTIMAL BLUE
Optimal Blue powers strategic performance across the mortgage capital markets ecosystem. As the industry’s only end-to-end capital markets platform, our technology, data and integrations bridge the primary and secondary markets to help lenders of all sizes optimize performance – from pricing accuracy to margin protection and every step in between. Backed by over 20 years of proven expertise, our modern, cloud-native technology delivers the real-time automation, actionable data and seamless connectivity lenders need to navigate market volatility and scale for growth. To learn more about how Optimal Blue helps deliver measurable ROI, visit OptimalBlue.com.
IMAGE link for media: https://www.Send2Press.com/300dpi/26-1013-s2p-opbchart-300dpi.webp
IMAGE caption: Optimal Blue’s September 2026 Market Advantage mortgage data report.
This press release was issued on behalf of the news source (Optimal Blue), who is solely responsible for its accuracy, by Send2Press Newswire.
To view the original story, visit: https://www.send2press.com/wire/optimal-blue-report-non-qm-bucks-september-slowdown-as-mortgage-rates-surge/
Copr. © 2026 Send2Press® Newswire, Calif., USA. -- REF: S2P STORY ID: S2P138875 FCN26-4A
INFORMATION BELOW THIS PAGE, IF ANY, IS UNRELATED TO THIS PRESS RELEASE.
If you believe this article contains misleading, harmful, or spam content, please let us know.
Report this articleMore News
View More



Recent Quotes
View MoreQuotes delayed at least 20 minutes.
By accessing this page, you agree to the Privacy Policy and Terms Of Service.