


Financial News
With SPY Breaking Records, Is It Time to Bet on RSP?
The S&P 500 hit an all-time high of 696.53 on Tuesday. It was the index’s 54th new 52-week high of the past 12 months. It is now up 15% over the past year and nearly 88% over the past five years.
Rarely has passive investing looked so good. It surely can’t last? Can it?
Well, the one thing I know is that timing the markets, whether at a top or bottom, is a mug’s game. More often than not, you’ll lose that bet.
That’s not to say investors shouldn’t consider other potential options given the current situation.
Take the Invesco S&P 500 Equal Weight ETF (RSP). Over the past 52 weeks, it has trailed the SPDR S&P 500 ETF (SPY) by 539 basis points, even though it holds the same stocks.
We know the reason for the differential: The Magnificent Seven and other mega-cap AI-related stocks have led the way.
Who knows when this phenomenon will end? However, now more than ever, RSP could be a way to switch horses mid-race without getting burned.
Here’s why.
The Beauty of Equal-Weight ETFs Like RSP
I’ve always considered equal-weight ETFs to be a lot like a well-managed sports team. The good ones get production from all kinds of places, not just from the star receiver or shortstop.
While I don’t want to rehash the negatives of owning a top-heavy market cap-weighted index like the S&P 500, it is important to note that the S&P 500 Equal Weight Index, the index that RSP tracks, is a lot like my Toronto Blue Jays; you never know where the well-timed hits are going to come from.
With the index and RSP rebalanced quarterly back to their original weightings of approximately 0.20% per stock, the holders of this ETF might not consistently achieve peak performance relative to SPY, but the winners each quarter will.
That’s because with RSP, the cream always rises to the top. That’s not necessarily the case with SPY. Yes, the S&P 500 continues to hit all-time records, but that increases the dominance of the top 10 holdings, which currently account for 38.53% of the portfolio, compared to 2.84% for RSP.
RSP’s top holding, with a 0.40% weighting, is SanDisk, the high-flying manufacturer of flash drives. Its weighting has essentially doubled since its rebalance on Dec. 19 after the markets closed. SNDK stock closed Dec. 19 at $237.61; yesterday, it closed at $481.43, a six-week return of 103%.
SPY’s top holding is Nvidia (NVDA) with a 7.68% weighting. It’s up 4.2% over the same six weeks.
How has RSP done compared to SPY over these six weeks? The former has gained 3.1%, while the latter is up 2.2%.
Is it possible that RSP could sustain this outperformance over the next year or two? Let’s consider the possibilities.
When Does RSP Perform Best?
Typically, RSP will often outperform SPY when smaller, value-oriented stocks are doing well. Since Dec. 19, the iShares Core S&P Small-Cap ETF (IJR), which tracks the S&P SmallCap 600 Index, is up 4.3%. Meanwhile, the iShares S&P Small-Cap 600 Value ETF (IJS), tracks the performance of the value stocks in the small-cap index. It’s up 5.0% since Dec. 19.
Interestingly, because the S&P 500 Equal Weight Index sells its winners and buys more of its losers each quarter, equal-weight portfolios tend to do better when economies are strong and business is good.
“‘Generally, equal weight is going to work well when the size and the value factors are doing well,’ Nick Kalivas, head of factor and core equity product strategy for Invesco, told VettaFi in May 2023. ‘That tends to be accelerating economic growth, falling risk — either falling equity volatility or falling credit spreads. It’s going to tend to lag in the opposite,’” ETF Trends reported.
We know that credit spreads have tightened in the past year. However, it’s tough to claim that economic growth is accelerating, while the markets unquestionably face rising risk due to historically expensive stock valuations.
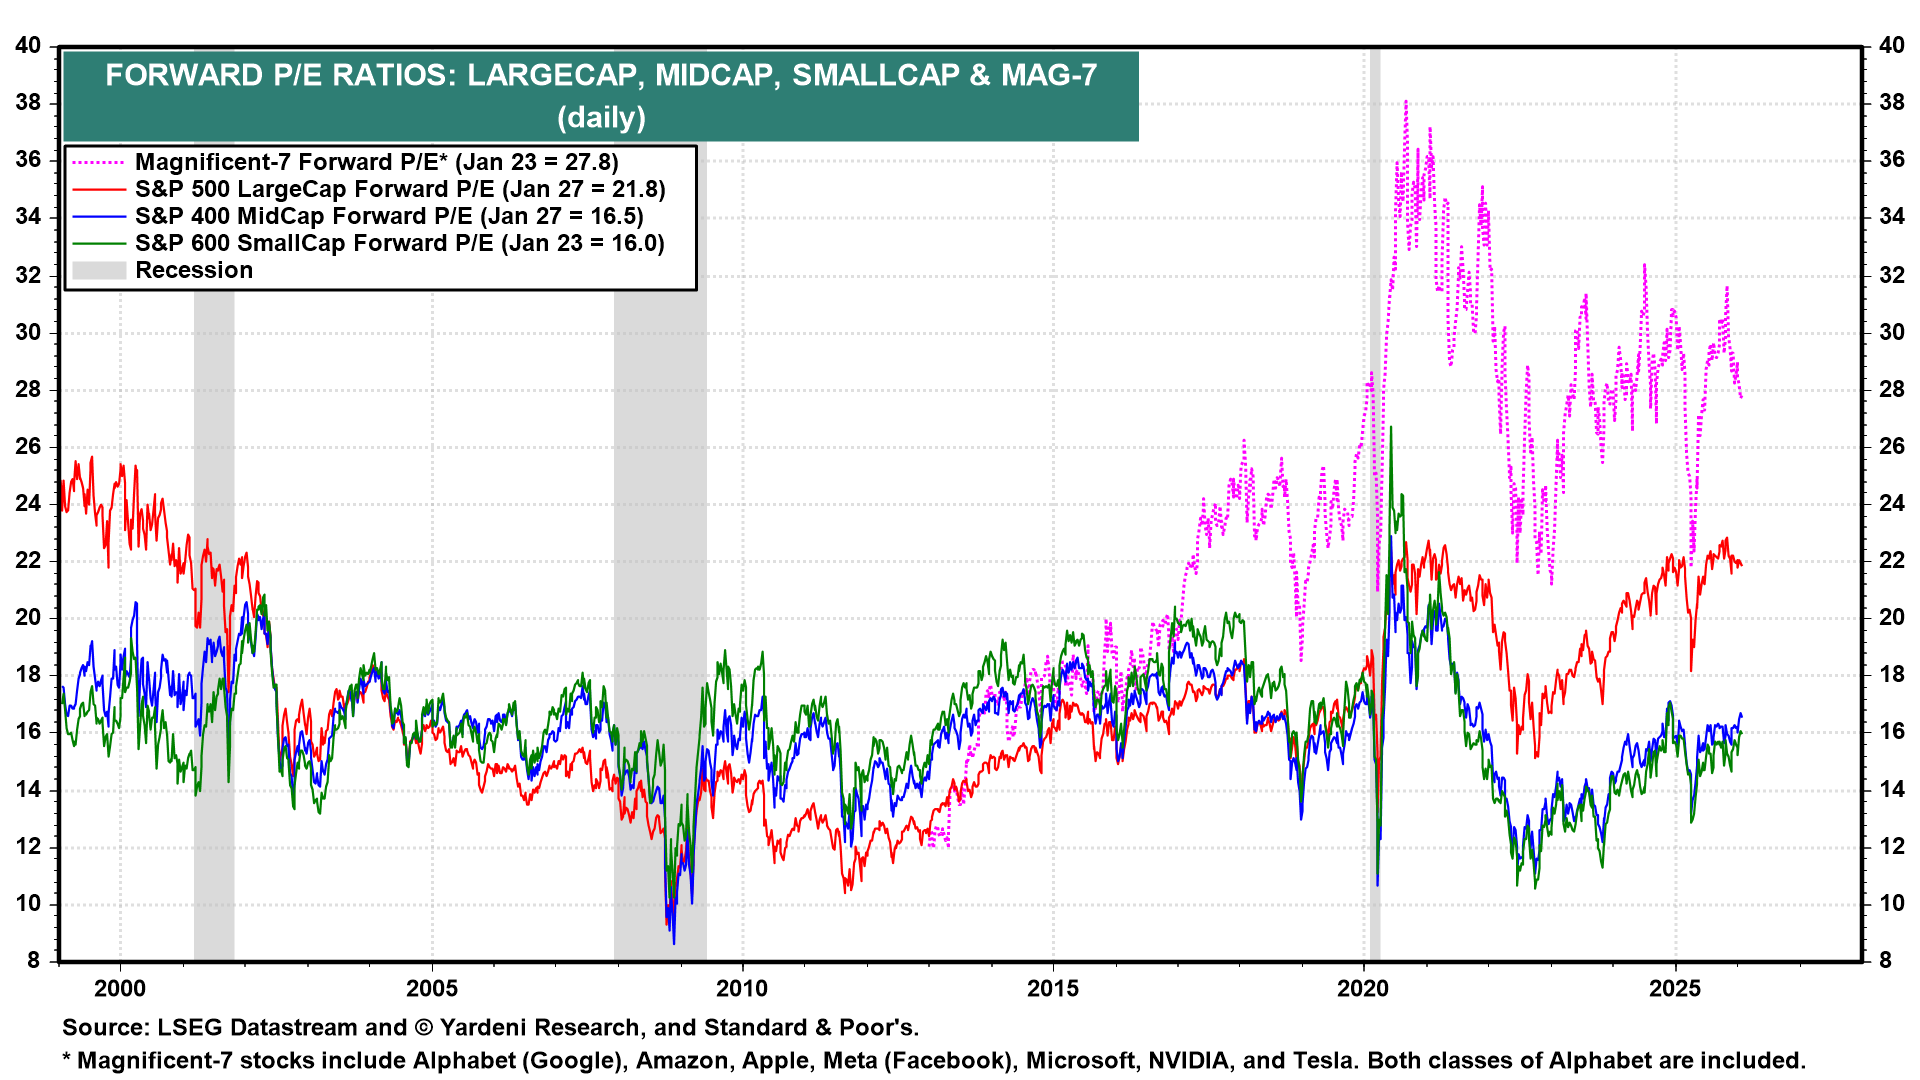
According to the chart from Yardeni Research pictured above, the S&P 500 forward P/E of 27.8 as of Jan. 23, is higher than it’s been since 2021, and 2002 before that. Meanwhile, small caps and mid-caps have forward P/E ratios that are relatively inexpensive at 16.0x and 16.5x, respectively. On two occasions since 2000, small- and mid-cap stocks traded at multiples of 20.0x or higher — 2002/2003 and 2020/2021.
We are definitely getting mixed signals right now.
However, where equal-weighted portfolios like RSP tend to outperform is when valuations are elevated, as they are today with large- and mega-cap stocks.
“‘One of the risks investors do face is that when they buy cap weighted, they’re kind of allocating more to those bigger names, and they are entering into higher valuations,’ Kalivas said. ‘I think if you’re looking out a year, a couple years, really that’s where the benefit of have equal weight or size or value. You have more appreciation potential given the discounted nature of the valuation,’ Kalivas added,” ETF Trends reported.
The Bottom Line: RSP vs. SPY
The weighted average market cap of SPY is $1.42 trillion. That’s 11.5 times larger than RSP’s at $123.9 billion. There’s no question that the cap-weighted version of the S&P 500 tilts heavily toward mega caps.
So, the million-dollar question is: where are valuations headed for small-, medium-, and large-sized S&P 500 companies over the next 12-24 months?
I’m not a soothsayer or fortune teller, but I incline to suggest that a reversion to the mean over this period will bring mega- and large-cap valuation multiples down, and small- and mid-cap valuation multiples up to historical norms.
That being the case, now seems like a good time to lean into RSP.
However, that doesn’t mean you have to abandon SPY. You merely need to change your allocation to each. For example, if SPY accounts for 100% of your large-cap holdings, you drop it to 70% and add 30% for RSP.
It really depends on your comfort level with the decision.
On the date of publication, Will Ashworth did not have (either directly or indirectly) positions in any of the securities mentioned in this article. All information and data in this article is solely for informational purposes. For more information please view the Barchart Disclosure Policy here.
More news from Barchart
- BlackRock’s New Covered Call Bitcoin ETF Is Another Red Flag for a Dangerous Investing Trend
- With SPY Breaking Records, Is It Time to Bet on RSP?
- As Government Shutdown Panic Swirls, Consider These 2 Top-Performing Gold ETFs to Buy Now
- 2 International Dividend ETFs To Watch as the 'Sell America' Trade Gains Popularity
More News
View More


Recent Quotes
View MoreQuotes delayed at least 20 minutes.
By accessing this page, you agree to the Privacy Policy and Terms Of Service.