


Financial News
Our Top Chart Strategist Analyzes the 'Generational Buying Opportunity' in Meta Stock
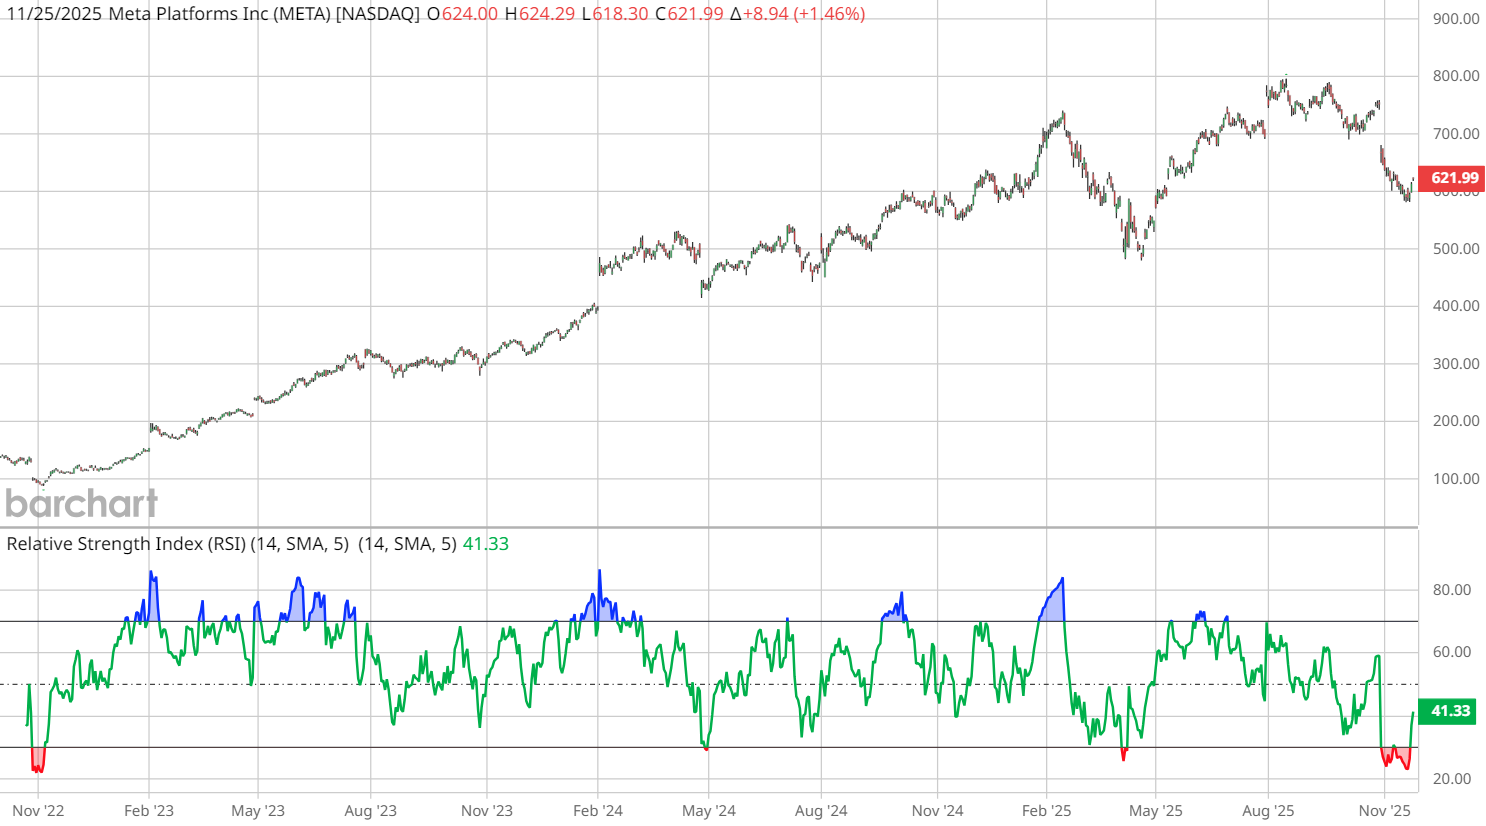
When a mega-cap stock like Meta Platforms (META) suddenly collapses into technically oversold territory, traders pay attention. But when it plunges all the way to a Relative Strength Index (RSI) reading of 23, hitting levels we haven’t seen since Meta bottomed near $100 in late 2022, the question becomes much bigger…
Is this a “generational buying opportunity” in META?
They might not care for the specific phrasing, but that’s exactly the question that co-hosts “Twitter Tom” and John Rowland, CMT, broke down in the latest Market on Close livestream — and the conversation highlights an important lesson for traders and long-term investors: “oversold” does not automatically mean an imminent reversal on the horizon.
Here’s the deeper analysis behind the chart, and how you can use Barchart tools to evaluate setups like this in real time.
Why Meta’s RSI Matters
The Relative Strength Index (RSI) is one of the most widely used momentum oscillators.
Generally speaking, traders interpret readings as follows:
- RSI above 70 = Overbought
- RSI below 30 = Oversold
META’s recent RSI drop to 23 signals extreme downside pressure. Historically, this kind of deeply depressed RSI level often precedes a rebound… but not always immediately.
Tom points out something critical:
“The last time RSI hit these levels was November 2022, when META bottomed at $100… and that was a generational buying opportunity.”
He’s not exaggerating. That prior oversold RSI reading marked META’s lowest point in years, right before the stock began a massive multi-year rally.
So does that mean today’s RSI reading opens up the same playbook again?
Well, not so fast…
John’s Take: Oversold ≠ Immediate Reversal
Senior Market Strategist John Rowland explains the nuances at play here:
- Stocks can remain oversold for a long time
- Price action can “pin” to the low end as buyers stay on the sidelines
- Even oversold conditions require confirmation, not assumptions
This is where traders get caught up, because they see a low RSI and assume the reversal must be coming imminently. But John highlights at least one technical factor that could be a spoiler for trigger-happy META bulls.
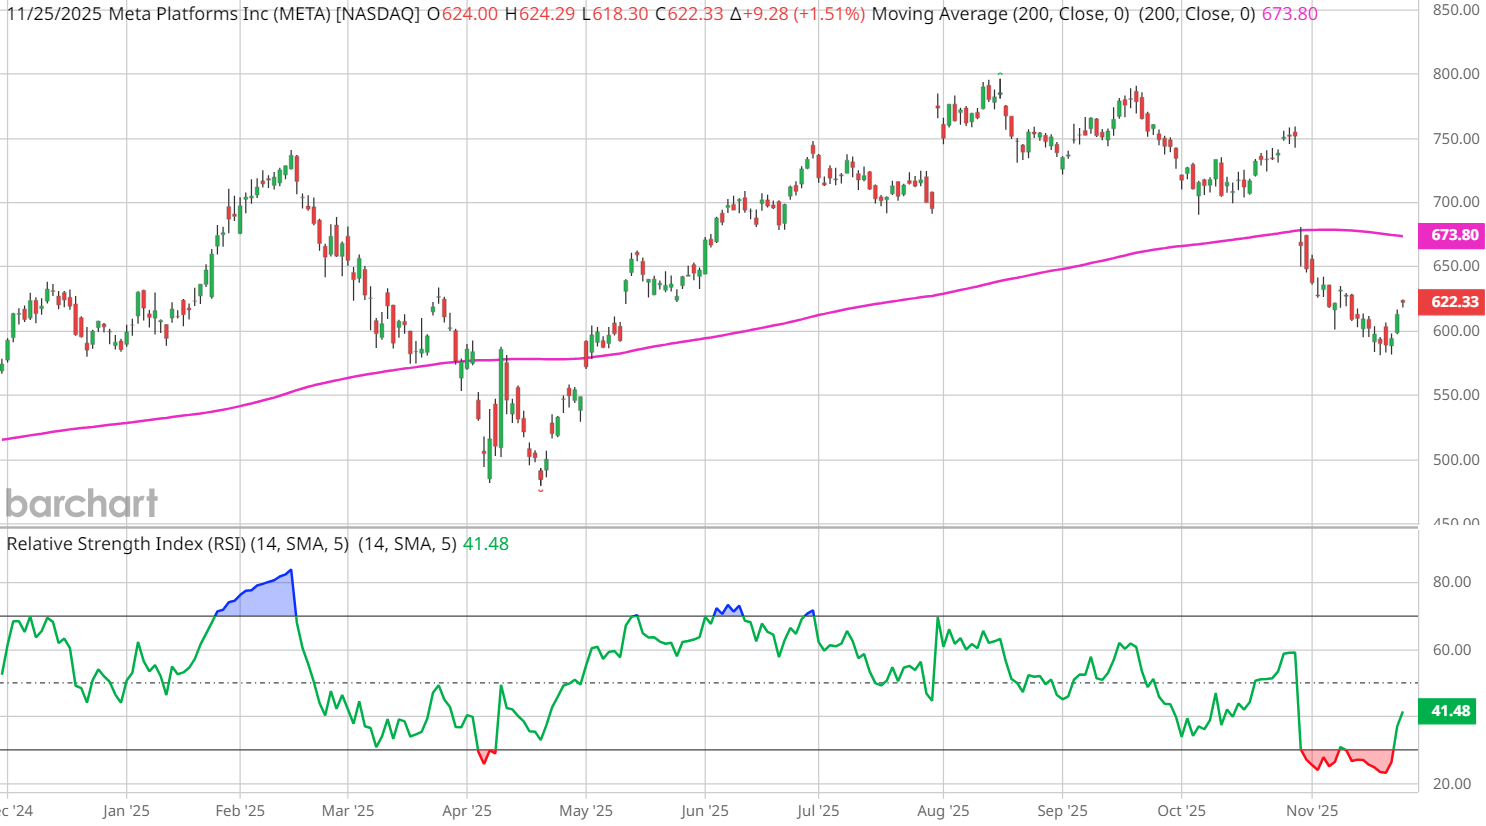
The 200-Day Moving Average
According to John:
“I might not even want to buy META until it gets back above the 200-day. Because what happens below the 200-day? Nothing good.”
This simple principle is one of the oldest acid tests for momentum:
- Above the 200-day → Trend is healthy
- Below the 200-day → Increased risk, weak momentum, failed rallies
META today is still below that key moving average, meaning the dominant trend is still questionable — even as the stock works out of its deeply oversold RSI status.
The Gap Levels That Matter
John mentions another important piece of the puzzle: price gaps.
META’s rally has left multiple gaps below its current price. These chart gaps often act as magnets, support/resistance zones, and targets for future reversal moves.
To call this a true buying opportunity, John would like to see:
- A stabilization (sideways movement)
- A reclaiming of the 200-day
- A clean technical base before momentum returns
- The RSI cross over 50, penetrate 60 and maintain above 40
"Downtrends tend to keep the RSI below 60, just as uptrends keep it above 40," Rowland explains. "So in that sense, it would be a stronger buy confirmation if the RSI were able to penetrate above 60 after emerging out of oversold condition. Of course, you will have some lost opportunities with a higher price (higher RSI), but you will gain a greater probability of success."
This is disciplined trading — not emotional buying.
So… Is META Stock a Buy?
The answer: potentially… but not yet.
John notes that Meta’s ongoing oversold condition today, “which is much more severe than back in April, didn't result in a lower price; this type of divergence can be interpreted as a bullish signal.”
That means there’s potential to trade META here, even if it’s likely too soon to own the shares.
“Could you buy it in the hopes of it trading back to the 200-day moving average?” says John. “You could, but there's no guarantee. The only thing I can guarantee is that it is oversold in multiple time frames and downtrends.”
Meta’s RSI tells us the stock is washed out, and history shows these setups can lead to major rallies. However, momentum and positioning still matter.
According to John, the patient trader is the profitable one. The next big META move will come after the chart shows stability, not before.
Watch the clip to see John’s chart analysis in action:
Stream the full episode of Market on Close
On the date of publication, Barchart Insights did not have (either directly or indirectly) positions in any of the securities mentioned in this article. All information and data in this article is solely for informational purposes. For more information please view the Barchart Disclosure Policy here.
More news from Barchart
- Occidental Petroleum Could Hike Its Dividend - Price Target is At Least 21% Higher
- This ‘Strong Buy’ Retail Stock Has Great Earnings Growth and Has Doubled This Year
- Our Top Chart Strategist Analyzes the 'Generational Buying Opportunity' in Meta Stock
- Corporate Insiders Have Sold $25 Billion in Stock in Just 60 Days. Before You Panic and Sell Your Shares, Read This.
More News
View More


Recent Quotes
View More
Quotes delayed at least 20 minutes.
By accessing this page, you agree to the Privacy Policy and Terms Of Service.