


Financial News
An update on the seasonal FOMO stampede
January 03, 2021 at 13:52 PM EST
Preface: Explaining our market timing models
We maintain several market timing models, each with differing time horizons. The "Ultimate Market Timing Model" is a long-term market timing model based on the research outlined in our post, Building the ultimate market timing model. This model tends to generate only a handful of signals each decade.
The Trend Asset Allocation Model is an asset allocation model that applies trend following principles based on the inputs of global stock and commodity price. This model has a shorter time horizon and tends to turn over about 4-6 times a year. In essence, it seeks to answer the question, "Is the trend in the global economy expansion (bullish) or contraction (bearish)?"
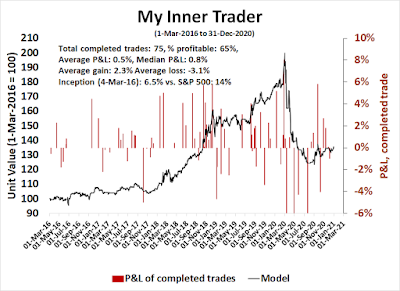
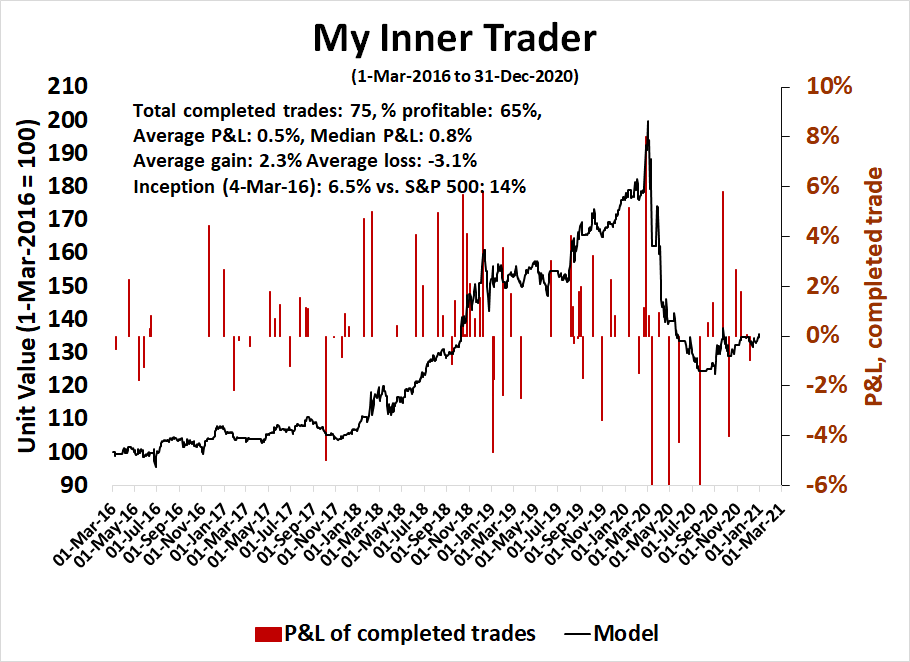
My inner trader uses a trading model, which is a blend of price momentum (is the Trend Model becoming more bullish, or bearish?) and overbought/oversold extremes (don't buy if the trend is overbought, and vice versa). Subscribers receive real-time alerts of model changes, and a hypothetical trading record of the email alerts are updated weekly here. The hypothetical trading record of the trading model of the real-time alerts that began in March 2016 is shown below.
The latest signals of each model are as follows:
Update schedule: I generally update model readings on my site on weekends and tweet mid-week observations at @humblestudent. Subscribers receive real-time alerts of trading model changes, and a hypothetical trading record of those email alerts is shown here.
Subscribers can access the latest signal in real-time here.
No stampede
Three weeks ago, I rhetorically asked if the market would surge higher during a seasonally favorable time of year (see Time for another year-end FOMO stampede?). I observed that "the Fear & Greed Index followed a pattern of an initial high, a retreat, followed by a higher high either coincident or ahead of the ultimate stock market peak." (Warning, small sample size of n=4).
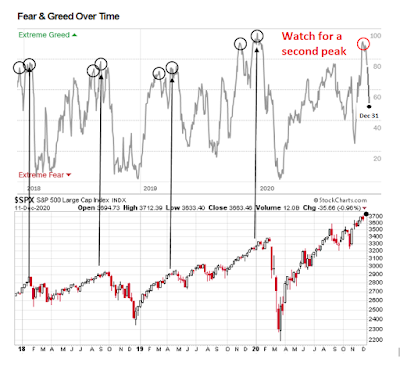
Since I wrote those words, the S&P 500 rose a respectable 2.5% while the Fear and Greed Index fell to 51. It's not exactly a stampede. The main question is: "Will Fear and Greed exhibit a second peak before the actual market peak?"
The full post can be found here.

We maintain several market timing models, each with differing time horizons. The "Ultimate Market Timing Model" is a long-term market timing model based on the research outlined in our post, Building the ultimate market timing model. This model tends to generate only a handful of signals each decade.
The Trend Asset Allocation Model is an asset allocation model that applies trend following principles based on the inputs of global stock and commodity price. This model has a shorter time horizon and tends to turn over about 4-6 times a year. In essence, it seeks to answer the question, "Is the trend in the global economy expansion (bullish) or contraction (bearish)?"
My inner trader uses a trading model, which is a blend of price momentum (is the Trend Model becoming more bullish, or bearish?) and overbought/oversold extremes (don't buy if the trend is overbought, and vice versa). Subscribers receive real-time alerts of model changes, and a hypothetical trading record of the email alerts are updated weekly here. The hypothetical trading record of the trading model of the real-time alerts that began in March 2016 is shown below.
The latest signals of each model are as follows:
- Ultimate market timing model: Buy equities*
- Trend Model signal: Bullish*
- Trading model: Bullish*
Update schedule: I generally update model readings on my site on weekends and tweet mid-week observations at @humblestudent. Subscribers receive real-time alerts of trading model changes, and a hypothetical trading record of those email alerts is shown here.
Subscribers can access the latest signal in real-time here.
No stampede
Three weeks ago, I rhetorically asked if the market would surge higher during a seasonally favorable time of year (see Time for another year-end FOMO stampede?). I observed that "the Fear & Greed Index followed a pattern of an initial high, a retreat, followed by a higher high either coincident or ahead of the ultimate stock market peak." (Warning, small sample size of n=4).
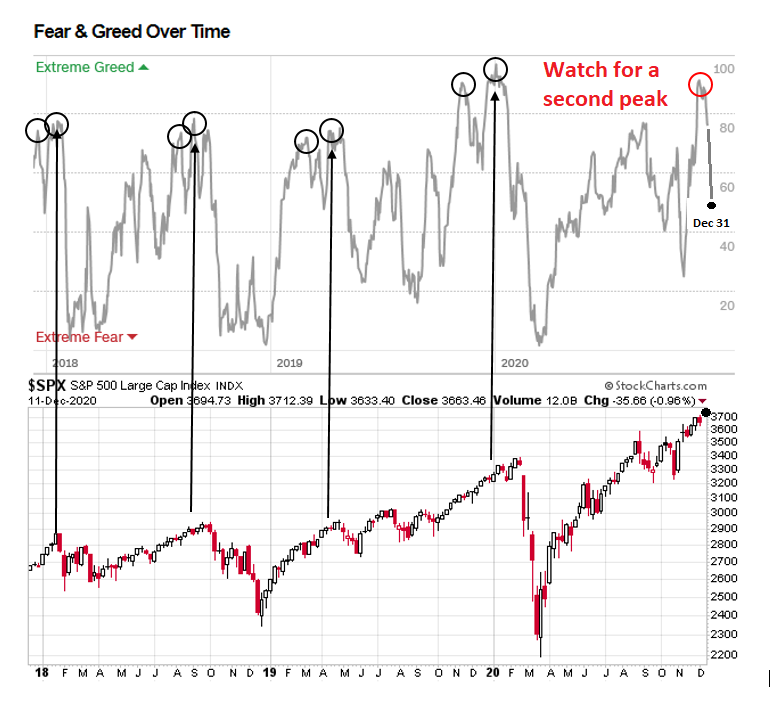
Since I wrote those words, the S&P 500 rose a respectable 2.5% while the Fear and Greed Index fell to 51. It's not exactly a stampede. The main question is: "Will Fear and Greed exhibit a second peak before the actual market peak?"
The full post can be found here.

Data & News supplied by www.cloudquote.io
Stock quotes supplied by Barchart
Quotes delayed at least 20 minutes.
By accessing this page, you agree to the following
Privacy Policy and Terms and Conditions.
Stock quotes supplied by Barchart
Quotes delayed at least 20 minutes.
By accessing this page, you agree to the following
Privacy Policy and Terms and Conditions.