


Financial News
Silver FINALLY Showing Signs of Capitulation
It’s been a rough couple of months for silver (SLV) as the metal has slipped from a rank of 3rd among over 100 ETFs in terms of performance to 11th as of yesterday’s close. While this might not seem like much of a fall, it’s come with a decline of nearly 30% in the metal in just three months, sending many silver miners (SIL) back into bear markets. Fortunately, silver has managed above its key monthly moving averages despite this precipitous decline, with the bulls defending the critical $21.50/oz level for the time being.
As long as this area continues to be defended, the bulls will remain in control of the bigger picture. However, there’s still no evidence the short-term correction is over, though we might have finally seen some capitulation last week.
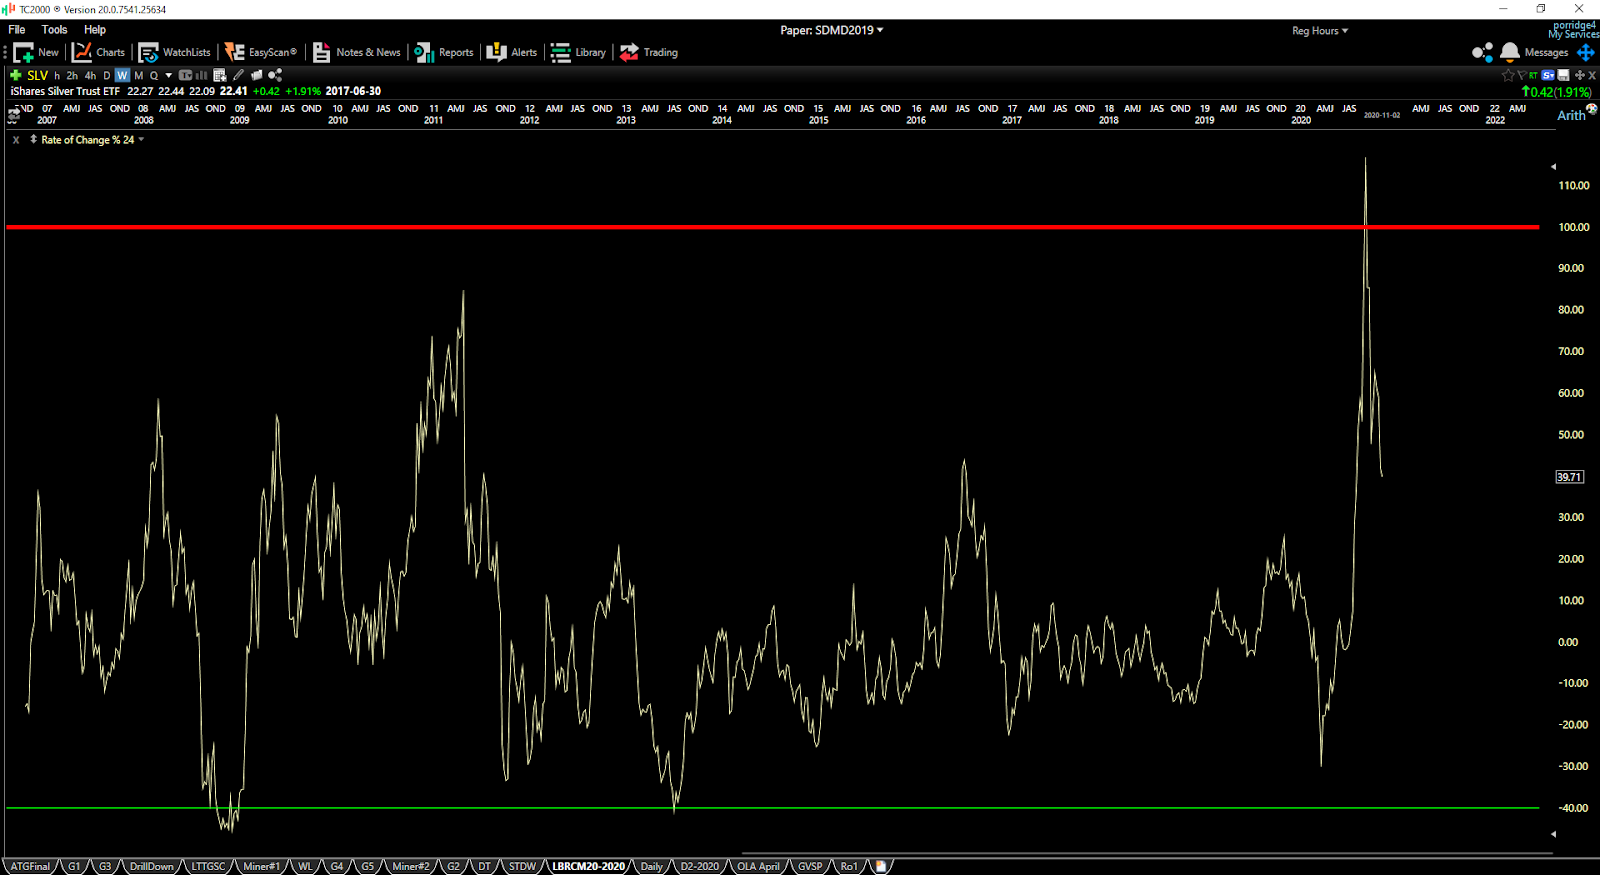
(Source: TC2000.com)
As the chart above shows, silver hit its most overbought reading in two decades earlier this year, with the metal’s 100-day rate of change soaring above 100%, pushing above the peak seen in the 2011 blow-off top.
Generally, rises of this magnitude fuel excessive speculation and extreme optimism, and the only direction an asset class can go after everyone is piling in is to the downside. This is precisely what we’ve seen since August, as silver has slid from $30.00/oz to a low near $22.50/oz, and the bull camp has learned a tough lesson that it’s never wise to chase miners or asset classes when they’ve gone parabolic. Fortunately, this sharp drop in the metal has washed out many of the bulls, and it’s possible that some of them finally capitulated last week. Let’s take a closer look below:

(Source: Daily Sentiment Index Data, Author’s Chart)
If we look at the chart above of bullish sentiment for silver, it’s clear that sentiment has done a 180 since August, falling from a reading of 96% bulls to just 17% bulls last week. While the reading of 17% bulls is not quite as low as I would have liked to see bullish sentiment drop, as it’s just outside of the extreme pessimism zone, it is a massive step in the right direction.
This means that last week we had only one bull for every four bears in the silver market from a sentiment standpoint, an improvement from 19 bulls for every one bear in early August. Generally, bullish sentiment readings this low occur near durable bottoms for an asset class, so I am now becoming open-minded that we’ve seen the worst of this correction for silver.
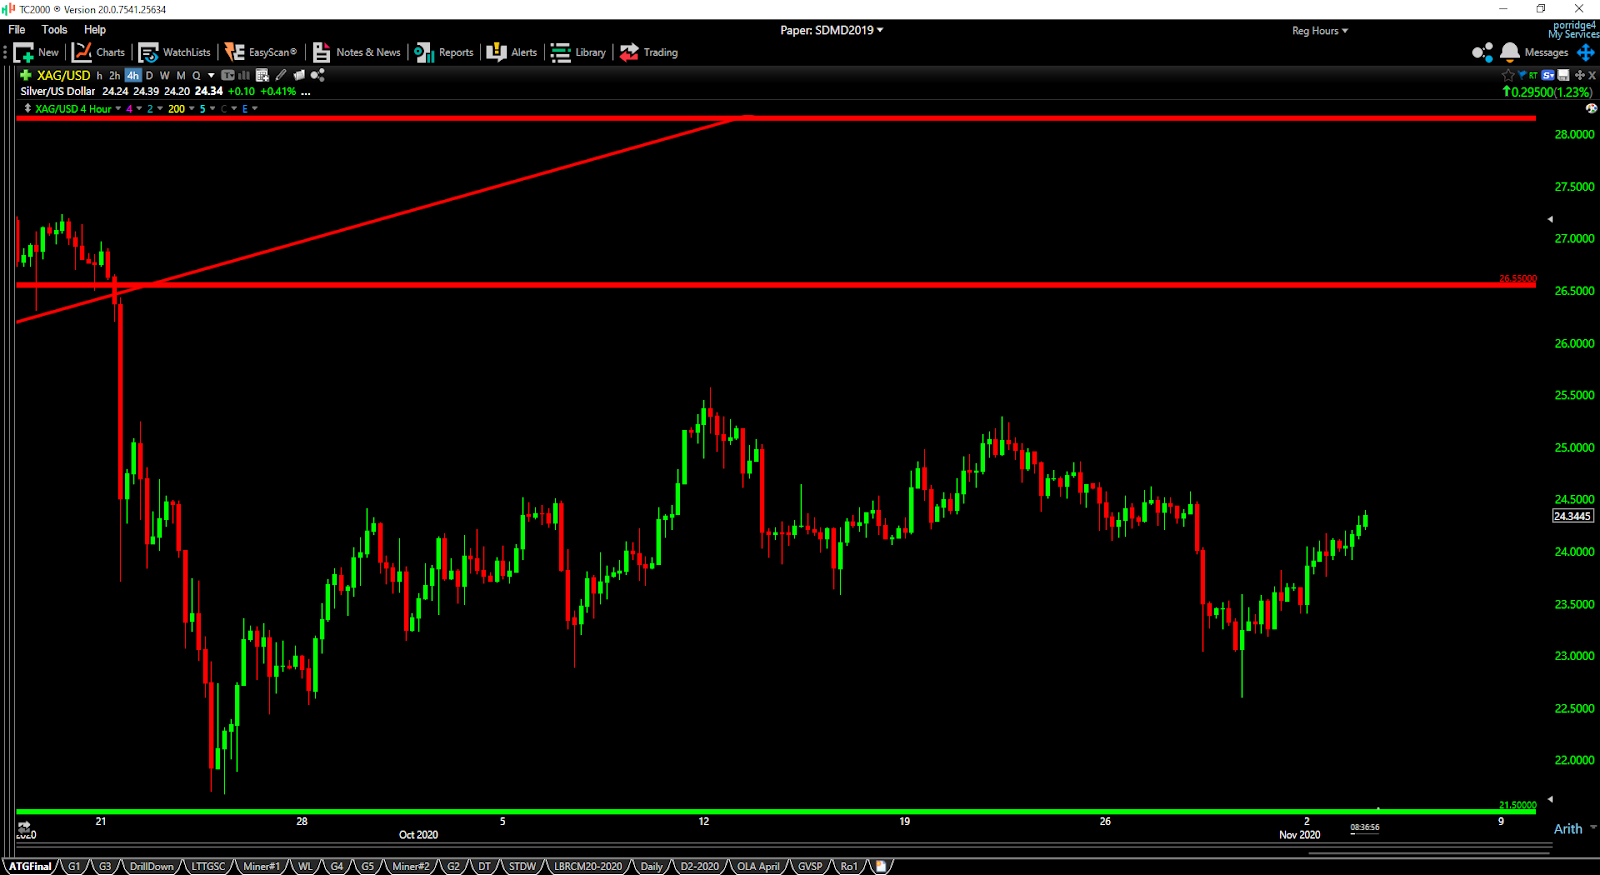
(Source: TC2000.com)
However, while sentiment suggests that we could finally be nearing a low or have seen the lows, we still remain in a violent correction. As the chart above shows, the bulls have had a tough time with the $25.00/oz - $26.00/oz level over the past two months, and until we get above this level, I would not be overly excited about rallies. Having said that, if the bulls can manage to punch through $26.55, this would significantly increase the probability that the lows are in, and this would allow investors to be confident buying dips in the miners again.
So, what’s the best course of action?
I am currently focused on gold miners (GDX) as they are more attractively valued, and gold (GLD) is much stronger than silver, hitting a new all-time high earlier this year. However, if silver were to get through $26.55/oz on increased volume, I would consider some new ideas in the silver sector.
One of the more attractive names in the group being Wheaton Precious Metals (WPM), and the most attractive speculative name being GoGold Resources. For now, I remain long gold and Kirkland Lake Gold (KL), which I see as the most undervalued gold producer at this juncture.
Disclosure: I am long GLD, KL, GLGDF
Disclaimer: Taylor Dart is not a Registered Investment Advisor or Financial Planner. This writing is for informational purposes only. It does not constitute an offer to sell, a solicitation to buy, or a recommendation regarding any securities transaction. The information contained in this writing should not be construed as financial or investment advice on any subject matter. Taylor Dart expressly disclaims all liability in respect to actions taken based on any or all of the information on this writing.
Want More Great Investing Ideas?
Why is the Stock Market Tanking Now?
7 Best ETFs for the NEXT Bull Market
5 WINNING Stocks Chart Patterns
GDX shares were trading at $39.10 per share on Tuesday morning, up $0.47 (+1.22%). Year-to-date, GDX has gained 33.54%, versus a 6.09% rise in the benchmark S&P 500 index during the same period.
About the Author: Taylor Dart

Taylor has over a decade of investing experience, with a special focus on the precious metals sector. In addition to working with ETFDailyNews, he is a prominent writer on Seeking Alpha. Learn more about Taylor’s background, along with links to his most recent articles.
The post Silver FINALLY Showing Signs of Capitulation appeared first on StockNews.com
Stock quotes supplied by Barchart
Quotes delayed at least 20 minutes.
By accessing this page, you agree to the following
Privacy Policy and Terms and Conditions.