


Financial News
Spotify Technology S.A. Announces Financial Results for Fourth Quarter 2019


Spotify Technology S.A. (NYSE:SPOT) today reported financial results for the fourth fiscal quarter of 2019 ending December 31, 2019.
This press release features multimedia. View the full release here: https://www.businesswire.com/news/home/20200205005323/en/
(Photo: Business Wire)
Dear Shareholders,
The business continued to perform well in 4Q19. For the third consecutive quarter, total MAU growth accelerated while Subscribers, Revenue, and Gross Margin all met or exceeded our expectations. We continue to see exponential growth in podcast hours streamed (up approximately 200% Y/Y) and are now seeing clear indications that podcast usage is driving increased overall engagement and retention. We have seen early indications that our investments in podcasts are having a positive impact on conversion of free to paid users. Overall, the business performance remains strong, and we believe we are well positioned for growth in the coming year.
2020 OUTLOOK
With three consecutive quarters of accelerating MAU growth and another year of record net subscriber additions behind us, we are enthusiastic about the underlying trends in the business. From history, we know that MAU growth tends to be a leading indicator of future subscriber additions, which is then followed by revenue gains in both premium and ad-supported users. While we believe these trends will continue moving forward, we have been appropriately conservative regarding our 2020 guidance as our data, particularly around the benefits from podcasts, is still reasonably new.
On the cost side, we have been consistent in our messaging. Any decision to accelerate our investment in podcast and technology spend should be viewed as an indication of our belief that our strategy is having tangible results. We have gained even more confidence in the data, particularly around the benefits from podcasts, and as a result, 2020 will be an investment year.
MONTHLY ACTIVE USERS (“MAUs”)
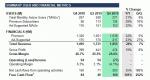
Total MAUs grew 31% Y/Y to 271 million, outperforming the high end of our guidance.
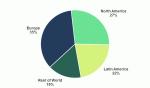
For the third straight quarter, we have outperformed the high end of our MAU guidance range as top-of-funnel growth continues to accelerate. Growth re-accelerated across our 3 largest regions (Europe, North America, and Latin America), while the Rest of World segment remains our fastest growing. Of note, North America saw the fastest quarterly growth since 4Q’18. Seeing a re-acceleration in user growth, at our scale, is a strong signal to us of the health of our business. We know, from history, that strong MAU trends are a harbinger of future subscriber and financial growth.
In previous quarters, we’ve spoken about continued innovation in the product experience. Some of these improvements yield immediate results, while others can take quarters to materialize into tangible benefits. With that in mind, in the last few quarters we have seen steady improvements in retention, in some cases significantly. Importantly, each of our top 20 markets has seen improvement in retention year on year. While further improvements are not explicitly assumed in our future expectations (2020 guidance below), our belief is that continued enhancements to the product and further growth in podcasts will lead to even better retention, higher conversion, and ultimately, higher lifetime value. We are seeing this thesis play out in our results to date, and you should expect us to continue to invest in product and innovation if these trends persist.
Results in Q4 were bolstered by our promotional activity. On December 5, 2019, we launched the 5th annual year-end Spotify Wrapped campaign. The campaign ran through the end of the month and was enhanced in several key ways this year. Importantly, we delivered the consumer experience via the native mobile app (in addition to a website hosted on Spotify.com) for the first time, expanded the reach of the campaign to 21 markets globally, highlighted insights from the past decade (in addition to the year), and provided a personalized Wrapped experience to all Spotify creators (inclusive of podcasters). More than 60 million users engaged with Wrapped content this year, spurring more than 40 million shares of Wrapped stories and cards and more than 6.5 billion streams from Year/Decade Top Songs playlists.
PREMIUM SUBSCRIBERS
We ended the year with 124 million Premium Subscribers globally, up 29% Y/Y and ahead of forecast. This was the highest net add quarter we’ve ever experienced, and the fastest we’ve ever added 10 million subscribers. During Q4 we expanded our ‘3 months on us’ offer to new Family Plan subscribers, in addition to previous offers for Individual and Student.
Q4 saw the continuation of our Google Home partnership whereby new and existing subscribers to our Individual, Student, and Family Plans in the US could claim a free Google Home Mini. To date, this partnership has driven a meaningful amount of incremental subscribers. In addition to Google, we also launched two new partnerships and renewed one existing partnership during Q4: the UK’s largest electronics retailer Curry’s PC World, Microsoft’s gaming subscription XBOX Game Pass in the US and UK, and a renewal with one of France’s largest telco operators, Bouygues. Each deal features a 6-month free trial to Spotify Premium for eligible participants.
Once again, we ran our annual year-end promotional Holiday Campaign. This year’s marketing campaign focused on our ‘3 months on us’ intro offer for new users, as well as a win-back offer for returning customers. We finished the year strong, boosted by strong Free MAU growth, the success of the Wrapped campaign, and higher than expected seasonality lift over the holiday period.
Churn improved more than 80 bps Y/Y and more than 50 bps sequentially. However, it’s worth noting that the change in our promotional strategy had a positive impact.
FINANCIAL METRICS
Revenue
Total revenue of €1,855 million grew 24% Y/Y in Q4. Consolidated revenue was in line with our expectations with Premium slightly better and Ad-Supported slightly weaker than forecast. Premium revenue was €1,638 million, up 24% Y/Y, while Ad-Supported revenue was €217 million, up 23% Y/Y.
For the Premium business, average revenue per user (“ARPU”) of €4.65 in Q4 was down 5% Y/Y (down 6% excluding the impact from FX rates). A significant portion of this decline was driven by the extension of the free trial period across our entire product suite in the quarter. Excluding the impact of Trials & Campaigns, ARPU would have declined 2% Y/Y as a result of continued mix shifts in product and geography.
Ad-Supported revenue growth of 23% Y/Y was an acceleration from Q3, but still fell slightly short of expectations. We had a slower start than usual in Q4, particularly in our Direct business, following some of the technical issues we had implementing a new order management system last quarter. By December, momentum in bookings had returned to normal levels but wasn’t enough to compensate for the slower start to the quarter. With that said, we still saw double digit rates of growth across each of our Direct, Programmatic, and Ad Studio channels. During Q4 we introduced Dynamic Ad Breaks (“DAB”) in the US and UK which added significant sellable inventory. We plan to expand this capability into 10 more markets in Q1 and will continue to scale these capabilities as content becomes increasingly available over our total geographic footprint.
Gross Margin
Gross Margin was 25.6% in Q4, toward the high end of our guidance range. The largest driver of outperformance stemmed from slight improvement in the non-royalty component of Gross Margin, including payment fees, streaming delivery costs, and other miscellaneous variances. Royalty costs were in line with our expectations. Q4 2019 Gross Margin compares with a 26.7% Gross Margin in 2018. As a reminder, our Q4 2018 Gross Margin included a number of one-time benefits. Excluding those non-recurring items, the Gross Margin in Q4 2018 would have been 25.8%
Premium Gross Margin was 26.9% in Q4, up from 26.5% in Q3, but down 40 bps Y/Y. Ad-Supported Gross Margin was 15.4% in Q4, down from 16.0% in Q3 and down 670 bps Y/Y.
Operating Expenses / Income (Loss)
Operating expenses of €551 million in Q4 increased 80% Y/Y, largely driven by higher than expected social charges resulting from an increase in our share price. Excluding the higher than planned social charges, Operating Loss would have finished slightly better than forecast as a result of the slight outperformance in Gross Profit.
As a reminder, social charges are payroll taxes associated with stock based compensation. We are subject to social taxes in several countries in which we operate, although Sweden accounts for the bulk of the social costs. We don’t forecast stock price changes in our guidance so upward or downward movements will impact our reported operating expenses. In Q4, the increase in our share price resulted in social charges that were more than €20 million higher than planned.
Podcasts
We continue to see exponential growth in podcast consumption. More than 16% of our Total MAUs now engage with Podcast content, and consumption hours in Q4 have grown nearly 200% Y/Y.
Today, we now have more than 700,000 podcast titles available on the platform. We added personalized elements to the podcast experience in Q4 with the launch of Your Daily Podcasts in several of our priority podcast markets including the US, UK, Germany, Sweden, Mexico, Brazil, Canada, Australia, and New Zealand. During Q4, we also released 26 shows in markets outside of the US to capitalize on the growing global trend of consumption. These included, but were not limited to, Hypnosis Radio in Japan, Fausto in Mexico (which quickly became the #1 podcast in the country), an adaptation of Parcast title Cults for German audiences called SEKTEN & KULTE, and our first three original podcasts in India: 22 Yarns, Love Aaj Kal, and Bhaskar Bose. We also held the first-ever Spotify for Podcasters summit in Brazil, a 2-day event in Sao Paulo where we welcomed more than 1,000 creators with 32 panels and 11 workshops. After previewing with the US audience, we also expanded the Your Daily Drive concept to encompass users in Germany and Sweden in Q4.
As we mentioned last quarter, we have a growing body of evidence showing that there are significant benefits to engagement, retention, and conversion of users from Ad-Supported to Premium stemming from consumption of Podcast content. We have seen benefits to retention on the order of several hundred basis points, which is a material change on a retention curve, for users that engage with spoken word content relative to those that haven’t, and early data indicates that these users are more likely to convert to Premium over time. However, there is still work to be done to model the future impact we expect podcasts to have on our metrics, and while we firmly believe these benefits will begin to flow through the model over time, we have been cautious with respect to including the impact of these efforts to our 2020 guidance. Expect us to update our views on this front as we gather and process more data over the course of the year, but we have been extremely pleased with the underlying trends.
Two-Sided Marketplace
Our two-sided marketplace strategy means we’re not just serving listeners; we’re also building tools and services for the creator community — everyone from artists and songwriters to publishers and labels to podcasters and storytellers.
The goal of our creator-facing marketplace strategy is to harness Spotify’s ability to drive discovery to connect artists with fans on a scale that has never before existed with the goal of enabling 1 million artists to live off of their work. Specifically, Marketplace is about meeting the needs of creator teams to create art, engage with, grow, and better monetize their fanbase.
These initiatives drive a combination of revenue through selling paid marketplace tools to creators and their teams, as well as content cost savings through negotiating more favorable licensing rates with certain segments of content suppliers. For the full year 2019 paid marketplace tools combined with strategic licensing contributed more than €30 million in Gross Profit. As adoption picks up among more of our partners, we expect the growth rate to increase and become a meaningful source of Gross Profit over the next few years. For 2020, we expect growth in Marketplace contribution to be in excess of 50%.
Recent highlights of positive developments with our marketplace strategy include:
- Spotify for Artists: Launched the year-end “Artist Wrapped” campaign to drive engagement among existing Spotify for Artists users and acquire new ones. Artist Wrapped is the industry version of our consumer 2019 Wrapped campaign. It is a tailor-made experience for artist teams that summarizes the highlights of their year on Spotify and how listeners engaged with their work. There are now over 500,000 monthly active artists and creators on Spotify for Artists, and we expect the platform to be the main entry point for most of our paid creator tools.
- Sponsored Recommendations: As discussed in previous earnings calls, we see native content promotion as an area of high value to both artists and listeners and also as a new higher margin revenue stream for Spotify. Our sponsored new release recommendation is targeted to both Ad-Supported and Premium listeners on mobile and is a personalized reminder for users to stream an album that we believe they’ll like. For labels and artists, this tool is an opportunity to reach the right audience at the right time in ways they can’t with other platforms. In October 2019, we launched the Beta in the United States. Our primary goal with the Beta in Q4 was learning, keeping a close eye on listener and customer feedback to evaluate product-market fit. Average click-through rates and average listener conversion have been at consistently high rates (+30% for each). Additionally, sponsored recommendations have had no noticeable effect on our Premium retention, with feedback suggesting users find the content relevant and valuable. Early indications on the artist side are also very encouraging. Not only can sponsored recommendations have a significant impact on awareness, but this tool is proving to be very effective in ensuring an artist seamlessly finds its audience. Compared to a control group, we have seen sponsored recommendations drive a material increase in both saves and plays. For example, the independent distributor, Caroline, leveraged sponsored recommendations for the release of their highly anticipated fourth album from Trippie Redd, which opened at #1.
- Other - We will continue to grow and expand the marketplace strategy, including with services such as Soundtrap and Soundbetter. As an example, while still early days, Soundtrap doubled its paying subscriber base in Q4. Expect more innovation of products over the coming years.
Lease Accounting
Starting January 1, 2019, we adopted the new lease accounting standards dictated by IFRS 16. This required certain leases which were accounted for as operating leases be treated as finance leases going forward. Certain leases were reclassified as assets and liabilities on the balance sheet which yielded increased depreciation and interest expense, offset by a reduction in rental expense. We recognized €10 million of lease liability interest expense in finance costs during the fourth quarter of 2019.
Free Cash Flow
We generated €203 million in net cash flows from operating activities and €169 million in Free Cash Flow in Q4. We maintain positive working capital and expect similar dynamics in FY 2020, excluding the impact of capital expenditures associated with the build-out of new and existing offices and timing of certain payments to rights holders. We paid out approximately €32 million associated with our office builds in Q4.
In Q4, our quarterly free cash was boosted by a shift in timing with respect to a couple of payments. With some licensors, the timing of certain payments can be irregular. As a result, several payments have been shifted into Q1 of 2020 and as a result, we are expecting FCF to be negative in the first quarter of the year. However, we do expect to deliver positive Free Cash Flow for the year.
We ended Q4 with €1.8 billion in cash and cash equivalents, restricted cash, and short term investments.
Q1 2020 OUTLOOK
These forward-looking statements reflect Spotify’s expectations as of February 5, 2020 and are subject to substantial uncertainty.
Q1 2020 Guidance:
- Total MAUs: 279-289 million
- Total Premium Subscribers: 126-131 million
- Total Revenue: €1.71-€1.91 billion
- Gross Margin: 23.5-25.5%
- Operating Profit/Loss: €(65)-€(115) million
Full Year 2020 Guidance:
- Total MAUs: 328-348 million
- Total Premium Subscribers: 143-153 million
- Total Revenue: €8.08-€8.48 billion
- Gross Margin: 23.2-25.2%
- Operating Profit/Loss: €(150)-€(250) million
EARNINGS QUESTION & ANSWER SESSION
The Company will host a live question and answer session starting at 8 a.m. ET today on investors.spotify.com. Daniel Ek, our Founder and CEO, and Paul Vogel, our Chief Financial Officer, will be on hand to answer questions submitted to ir@spotify.com and via the live chat window available through the webcast. Participants also may join using the listen-only conference line:
Participant Toll Free Dial-In Number: (844) 343-9039
Participant International Dial-In Number: (647) 689-5130
Conference ID: 1654959
Use of Non-IFRS Measures
To supplement our interim condensed consolidated financial statements, which are prepared and presented in accordance with IFRS, we use the following non-IFRS financial measures: Revenue excluding foreign exchange effect, Premium revenue excluding foreign exchange effect, Ad-Supported revenue excluding foreign exchange effect, EBITDA, and Free Cash Flow. Management believes that Revenue excluding foreign exchange effect, Premium revenue excluding foreign exchange effect and Ad-Supported revenue excluding foreign exchange effect are important metrics because they present measures that facilitate comparison to our historical performance. However, Revenue excluding foreign exchange effect, Premium revenue excluding foreign exchange effect and Ad-Supported revenue excluding foreign exchange effect should be considered in addition to, not as a substitute for or superior to, Revenue, Premium revenue, Ad-Supported revenue or other financial measures prepared in accordance with IFRS. Management believes that EBITDA and Free Cash Flow are important metrics because they present measures that approximate the amount of cash generated that is available to repay debt obligations, to make investments, and for certain other activities that exclude certain infrequently occurring and/or non-cash items. However, these measures should be considered in addition to, not as a substitute for or superior to, net income, operating income, or other financial measures prepared in accordance with IFRS. For more information on these non-IFRS financial measures, please see “Reconciliation of IFRS to Non-IFRS Results” table.
Forward Looking Statements
This shareholder letter contains estimates and forward-looking statements. All statements other than statements of historical fact are forward-looking statements. The words “may,” “might,” “will,” “could,” “would,” “should,” “expect,” “plan,” “anticipate,” “intend,” “seek,” “believe,” “estimate,” “predict,” “potential,” “continue,” “contemplate,” “possible,” and similar words are intended to identify estimates and forward-looking statements.
Our estimates and forward-looking statements are mainly based on our current expectations and estimates of future events and trends, which affect or may affect our businesses and operations. Although we believe that these estimates and forward-looking statements are based upon reasonable assumptions, they are subject to numerous risks and uncertainties and are made in light of information currently available to us. Many important factors may adversely affect our results as indicated in forward-looking statements. These factors include, but are not limited to: our ability to attract prospective users and to retain existing users; competition for users and user listening time; our dependence upon third-party licenses for most of the content we stream; our lack of control over the providers of our content and their effect on our access to music and other content; our ability to comply with the many complex license agreements to which we are a party; our ability to accurately estimate the amounts payable under our license agreements; the limitations on our operating flexibility due to the minimum guarantees required under certain of our license agreements; our ability to obtain accurate and comprehensive information about music compositions in order to obtain necessary licenses or perform obligations under our existing license agreements; new copyright legislation that may increase the cost and/or difficulty of music licensing; risks associated with our international expansion, including difficulties obtaining rights to stream content on favorable terms; our ability to generate sufficient revenue to be profitable or to generate positive cash flow on a sustained basis; our ability to expand our operations to deliver content beyond music, including podcasts; potential breaches of our security systems; assertions by third parties of infringement or other violations by us of their intellectual property rights; our ability to accurately estimate our user metrics and other estimates; risks associated with manipulation of stream counts and user accounts and unauthorized access to our services; changes in legislation or governmental regulations affecting us; risks relating to privacy and protection of user data; our ability to maintain, protect, and enhance our brand; ability to hire and retain key personnel; risks relating to the acquisition, investment, and disposition of companies or technologies; tax-related risks; the concentration of voting power among our founders who have and will continue to have substantial control over our business; risks related to our status as a foreign private issuer; international, national or local economic, social or political conditions; and risks associated with accounting estimates, currency fluctuations and foreign exchange controls. A detailed discussion of these and other risks and uncertainties that could cause actual results and events to differ materially from our estimates and forward-looking statements is included in our filings with the U.S. Securities and Exchange Commission (“SEC”), including our Annual Report on Form 20-F filed with the SEC on February 12, 2019. We undertake no obligation to update forward-looking statements to reflect events or circumstances occurring after the date of this shareholder letter.)
Interim condensed consolidated statement of operations
| ||||||||||||||||||||
Three months ended | Year ended | |||||||||||||||||||
December 31, 2019 | September 30, 2019 | December 31, 2018 | December 31, 2019 | December 31, 2018 | ||||||||||||||||
Revenue | 1,855 | 1,731 | 1,495 | 6,764 | 5,259 | |||||||||||||||
Cost of revenue | 1,381 | 1,290 | 1,096 | 5,042 | 3,906 | |||||||||||||||
Gross profit | 474 | 441 | 399 | 1,722 | 1,353 | |||||||||||||||
Research and development | 173 | 136 | 100 | 615 | 493 | |||||||||||||||
Sales and marketing | 276 | 178 | 163 | 826 | 620 | |||||||||||||||
General and administrative | 102 | 73 | 42 | 354 | 283 | |||||||||||||||
551 | 387 | 305 | 1,795 | 1,396 | ||||||||||||||||
Operating (loss)/income | (77 | ) | 54 | 94 | (73 | ) | (43 | ) | ||||||||||||
Finance income | 7 | 226 | 389 | 275 | 455 | |||||||||||||||
Finance costs | (103 | ) | (10 | ) | (2 | ) | (333 | ) | (584 | ) | ||||||||||
Share in losses of associate | — | — | — | — | (1 | ) | ||||||||||||||
Finance income/(costs) - net | (96 | ) | 216 | 387 | (58 | ) | (130 | ) | ||||||||||||
(Loss)/income before tax | (173 | ) | 270 | 481 | (131 | ) | (173 | ) | ||||||||||||
Income tax expense/(benefit) | 36 | 29 | 39 | 55 | (95 | ) | ||||||||||||||
Net (loss)/income attributable to owners of the parent | (209 | ) | 241 | 442 | (186 | ) | (78 | ) | ||||||||||||
(Loss)/earnings per share attributable to owners of the parent | ||||||||||||||||||||
Basic | (1.14 | ) | 1.34 | 2.44 | (1.03 | ) | (0.44 | ) | ||||||||||||
Diluted | (1.14 | ) | 0.36 | 0.36 | (1.03 | ) | (0.51 | ) | ||||||||||||
Weighted-average ordinary shares outstanding | ||||||||||||||||||||
Basic | 182,942,528 | 179,863,596 | 181,067,994 | 180,960,579 | 177,154,405 | |||||||||||||||
Diluted | 182,942,528 | 188,477,554 | 190,511,148 | 180,960,579 | 181,210,292 | |||||||||||||||
Condensed consolidated statement of financial position
| ||||||||
December 31, 2019 | December 31, 2018 | |||||||
Assets | ||||||||
Non-current assets | ||||||||
Lease right-of-use assets | 489 | — | ||||||
Property and equipment | 291 | 197 | ||||||
Goodwill | 478 | 146 | ||||||
Intangible assets | 58 | 28 | ||||||
Long term investments | 1,497 | 1,646 | ||||||
Restricted cash and other non-current assets | 69 | 65 | ||||||
Deferred tax assets | 9 | 8 | ||||||
2,891 | 2,090 | |||||||
Current assets | ||||||||
Trade and other receivables | 402 | 400 | ||||||
Income tax receivable | 4 | 2 | ||||||
Short term investments | 692 | 915 | ||||||
Cash and cash equivalents | 1,065 | 891 | ||||||
Other current assets | 68 | 38 | ||||||
2,231 | 2,246 | |||||||
Total assets | 5,122 | 4,336 | ||||||
Equity and liabilities | ||||||||
Equity | ||||||||
Share capital | — | — | ||||||
Other paid in capital | 4,192 | 3,801 | ||||||
Treasury shares | (370 | ) | (77 | ) | ||||
Other reserves | 924 | 875 | ||||||
Accumulated deficit | (2,709 | ) | (2,505 | ) | ||||
Equity attributable to owners of the parent | 2,037 | 2,094 | ||||||
Non-current liabilities | ||||||||
Lease liabilities | 622 | — | ||||||
Accrued expenses and other liabilities | 20 | 85 | ||||||
Provisions | 2 | 6 | ||||||
Deferred tax liabilities | 2 | 2 | ||||||
646 | 93 | |||||||
Current liabilities | ||||||||
Trade and other payables | 549 | 427 | ||||||
Income tax payable | 9 | 7 | ||||||
Deferred revenue | 319 | 258 | ||||||
Accrued expenses and other liabilities | 1,438 | 1,076 | ||||||
Provisions | 13 | 42 | ||||||
Derivative liabilities | 111 | 339 | ||||||
2,439 | 2,149 | |||||||
Total liabilities | 3,085 | 2,242 | ||||||
Total equity and liabilities | 5,122 | 4,336 | ||||||
Interim condensed consolidated statement of cash flows
| |||||||||||||||||||||
Three months ended | Year ended | ||||||||||||||||||||
December 31, 2019 | September 30, 2019 | December 31, 2018 | December 31, 2019 | December 31, 2018 | |||||||||||||||||
Operating activities | |||||||||||||||||||||
Net (loss)/income | (209 | ) | 241 | 442 | (186 | ) | (78 | ) | |||||||||||||
Adjustments to reconcile net (loss)/income to net | |||||||||||||||||||||
cash flows | |||||||||||||||||||||
Depreciation of property and equipment and | 20 | 17 | 4 | 71 | 21 | ||||||||||||||||
lease right-of-use assets | |||||||||||||||||||||
Amortization of intangible assets | 4 | 5 | 4 | 16 | 11 | ||||||||||||||||
Share-based payments expense | 28 | 31 | 23 | 122 | 88 | ||||||||||||||||
Finance income | (7 | ) | (226 | ) | (389 | ) | (275 | ) | (455 | ) | |||||||||||
Finance costs | 103 | 10 | 2 | 333 | 584 | ||||||||||||||||
Income tax expense/(benefit) | 36 | 29 | 39 | 55 | (95 | ) | |||||||||||||||
Other | 14 | 1 | 15 | 13 | 8 | ||||||||||||||||
Changes in working capital: | |||||||||||||||||||||
(Increase)/decrease in trade receivables and other assets | (14 | ) | 2 | (59 | ) | (27 | ) | (61 | ) | ||||||||||||
Increase in trade and other liabilities | 222 | 2 | 57 | 454 | 291 | ||||||||||||||||
Increase in deferred revenue | 15 | 12 | 17 | 59 | 38 | ||||||||||||||||
Decrease in provisions | 1 | (44 | ) | (7 | ) | (35 | ) | (17 | ) | ||||||||||||
Interest paid on lease liabilities | (12 | ) | (12 | ) | — | (37 | ) | — | |||||||||||||
Interest received | 2 | 4 | 3 | 14 | 18 | ||||||||||||||||
Income tax paid | — | (1 | ) | (1 | ) | (4 | ) | (9 | ) | ||||||||||||
Net cash flows from operating activities | 203 | 71 | 150 | 573 | 344 | ||||||||||||||||
Investing activities | |||||||||||||||||||||
Business combinations, net of cash acquired | — | (7 | ) | — | (331 | ) | (9 | ) | |||||||||||||
Purchases of property and equipment | (32 | ) | (26 | ) | (65 | ) | (135 | ) | (125 | ) | |||||||||||
Purchases of short term investments | (231 | ) | (268 | ) | (300 | ) | (901 | ) | (1,069 | ) | |||||||||||
Sales and maturities of short term investments | 165 | 245 | 66 | 1,163 | 1,226 | ||||||||||||||||
Change in restricted cash | (2 | ) | 3 | (1 | ) | 2 | (10 | ) | |||||||||||||
Other | (5 | ) | (4 | ) | — | (16 | ) | (35 | ) | ||||||||||||
Net cash flows used in investing activities | (105 | ) | (57 | ) | (300 | ) | (218 | ) | (22 | ) | |||||||||||
Financing activities | |||||||||||||||||||||
Payments of lease liabilities | (4 | ) | (4 | ) | — | (17 | ) | — | |||||||||||||
Lease incentives received | — | 15 | — | 15 | — | ||||||||||||||||
Repurchases of ordinary shares | (30 | ) | (125 | ) | (72 | ) | (438 | ) | (72 | ) | |||||||||||
Proceeds from exercise of stock options | 71 | 30 | 17 | 154 | 163 | ||||||||||||||||
Proceeds from the issuance of warrants | — | 15 | — | 15 | — | ||||||||||||||||
Proceeds from the exercise of warrants | 74 | — | — | 74 | — | ||||||||||||||||
Other | (2 | ) | (4 | ) | — | (6 | ) | 1 | |||||||||||||
Net cash flow from/(used in) financing activities | 109 | (73 | ) | (55 | ) | (203 | ) | 92 | |||||||||||||
Net increase/(decrease) in cash and | |||||||||||||||||||||
cash equivalents | 207 | (59 | ) | (250 | ) | 152 | 414 | ||||||||||||||
Cash and cash equivalents at beginning of the period | 877 | 909 | 1,095 | 891 | 477 | ||||||||||||||||
Net exchange (losses)/gains on cash and | |||||||||||||||||||||
cash equivalents | (19 | ) | 27 | 1 | 22 | -- | |||||||||||||||
Cash and cash equivalents at period end | 1,065 | 877 | 891 | 1,065 | 891 | ||||||||||||||||
Calculation of basic and diluted earnings/(loss) per share
| ||||||||||||||||||||
Three months ended | Year ended | |||||||||||||||||||
December 31, 2019 | September 30, 2019 | December 31, 2018 | December 31, 2019 | December 31, 2018 | ||||||||||||||||
Basic (loss)/earnings per share | ||||||||||||||||||||
Net (loss)/income attributable to owners of the parent | (209 | ) | 241 | 442 | (186 | ) | (78 | ) | ||||||||||||
Share used in computation: | ||||||||||||||||||||
Weighted-average ordinary shares outstanding | 182,942,528 | 179,863,596 | 181,067,994 | 180,960,579 | 177,154,405 | |||||||||||||||
Basic (loss)/earnings per share attributable | ||||||||||||||||||||
to owners of the parent | (1.14 | ) | 1.34 | 2.44 | (1.03 | ) | (0.44 | ) | ||||||||||||
Diluted (loss)/earnings per share | ||||||||||||||||||||
Net (loss)/income attributable to owners of the parent | (209 | ) | 241 | 442 | (186 | ) | (78 | ) | ||||||||||||
Fair value gains on dilutive warrants | — | (173 | ) | (373 | ) | — | (14 | ) | ||||||||||||
Net (loss)/income used in the computation of diluted (loss)/earnings per share | (209 | ) | 68 | 69 | (186 | ) | (92 | ) | ||||||||||||
Shares used in computation: | ||||||||||||||||||||
Weighted-average ordinary shares outstanding | 182,942,528 | 179,863,596 | 181,067,994 | 180,960,579 | 177,154,405 | |||||||||||||||
Warrants | — | 3,867,477 | 3,838,911 | — | 4,055,887 | |||||||||||||||
Share options | — | 4,436,345 | 5,483,881 | — | — | |||||||||||||||
Restricted stock units | — | 157,623 | 77,832 | — | — | |||||||||||||||
Restricted stock awards | — | 50,623 | 42,530 | — | — | |||||||||||||||
Other contingently issuable shares | — | 101,890 | — | — | — | |||||||||||||||
Diluted weighted-average ordinary shares | 182,942,528 | 188,477,554 | 190,511,148 | 180,960,579 | 181,210,292 | |||||||||||||||
Diluted (loss)/earnings per share attributable | ||||||||||||||||||||
to owners of the parent | (1.14 | ) | 0.36 | 0.36 | (1.03 | ) | (0.51 | ) | ||||||||||||
Reconciliation of IFRS to Non-IFRS Results
| ||||||||||||||||
Three months ended | Year ended | |||||||||||||||
December 31, 2019 | December 31, 2018 | December 31, 2019 | December 31, 2018 | |||||||||||||
IFRS revenue | 1,855 | 1,495 | 6,764 | 5,259 | ||||||||||||
Foreign exchange effect on 2019 revenue using 2018 rates | (21 | ) | (117 | ) | ||||||||||||
Revenue excluding foreign exchange effect | 1,834 | 6,647 | ||||||||||||||
IFRS revenue year-over-year change % | 24 | % | 29 | % | ||||||||||||
Revenue excluding foreign exchange effect year-over-year change % | 23 | % | 26 | % | ||||||||||||
IFRS Premium revenue | 1,638 | 1,320 | 6,086 | 4,717 | ||||||||||||
Foreign exchange effect on 2019 Premium revenue using 2018 rates | (15 | ) | (90 | ) | ||||||||||||
Premium revenue excluding foreign exchange effect | 1,623 | 5,996 | ||||||||||||||
IFRS Premium revenue year-over-year change % | 24 | % | 29 | % | ||||||||||||
Premium revenue excluding foreign exchange effect year-over-year change % | 23 | % | 27 | % | ||||||||||||
IFRS Ad-Supported revenue | 217 | 175 | 678 | 542 | ||||||||||||
Foreign exchange effect on 2019 Ad-Supported revenue using 2018 rates | (6 | ) | (27 | ) | ||||||||||||
Ad-Supported revenue excluding foreign exchange effect | 211 | 651 | ||||||||||||||
IFRS Ad-Supported revenue year-over-year change % | 23 | % | 25 | % | ||||||||||||
Ad-Supported revenue excluding foreign exchange effect year-over-year change % | 21 | % | 20 | % | ||||||||||||
EBITDA
| ||||||||||||||||||||
Three months ended | Year ended | |||||||||||||||||||
December 31, 2019 | September 30, 2019 | December 31, 2018 | December 31, 2019 | December 31, 2018 | ||||||||||||||||
Net (loss)/income attributable to owners of the parent | (209 | ) | 241 | 442 | (186 | ) | (78 | ) | ||||||||||||
Finance income/(costs) - net | 96 | (216 | ) | (387 | ) | 58 | 130 | |||||||||||||
Income tax expense/(benefit) | 36 | 29 | 39 | 55 | (95 | ) | ||||||||||||||
Depreciation and amortization | 24 | 22 | 8 | 87 | 32 | |||||||||||||||
EBITDA | (53 | ) | 76 | 102 | 14 | (11 | ) | |||||||||||||
Free Cash Flow
| ||||||||||||||||||||
Three months ended | Year ended | |||||||||||||||||||
December 31, 2019 | September 30, 2019 | December 31, 2018 | December 31, 2019 | December 31, 2018 | ||||||||||||||||
Net cash flows from operating activities | 203 | 71 | 150 | 573 | 344 | |||||||||||||||
Capital expenditures | (32 | ) | (26 | ) | (65 | ) | (135 | ) | (125 | ) | ||||||||||
Change in restricted cash | (2 | ) | 3 | (1 | ) | 2 | (10 | ) | ||||||||||||
Free Cash Flow | 169 | 48 | 84 | 440 | 209 | |||||||||||||||
1Free Cash Flow is a non-IFRS measure. See “Use of Non-IFRS Measures” and “Reconciliation of IFRS to Non-IFRS Results” for additional information.
View source version on businesswire.com: https://www.businesswire.com/news/home/20200205005323/en/
Contacts:
Michael Urciuoli
ir@spotify.com

Stock quotes supplied by Barchart
Quotes delayed at least 20 minutes.
By accessing this page, you agree to the following
Privacy Policy and Terms and Conditions.