


Financial News
Hilton Reports Second Quarter Results; Exceeds Net Income and Adjusted EBITDA Expectations

Hilton Worldwide Holdings Inc. ("Hilton" or the "Company") (NYSE: HLT) today reported its second quarter 2019 results. Highlights include:
This press release features multimedia. View the full release here: https://www.businesswire.com/news/home/20190724005172/en/
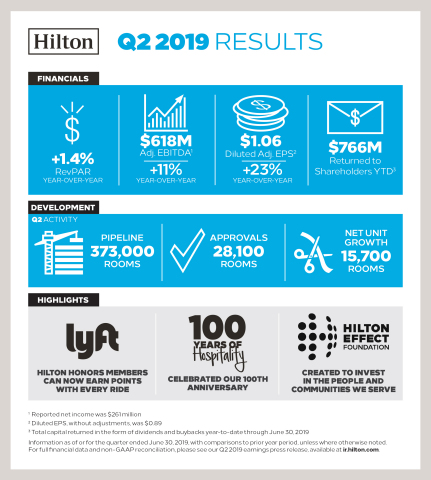
Hilton Reports Second Quarter 2019 Results (Graphic: Hilton)
- Diluted EPS was $0.89 for the second quarter, a 25 percent increase from the same period in 2018, and diluted EPS, adjusted for special items, was $1.06, a 23 percent increase from the same period in 2018
- Net income for the second quarter was $261 million, a 20 percent increase from the same period in 2018, exceeding the high end of guidance
- Adjusted EBITDA for the second quarter was $618 million, an 11 percent increase from the same period in 2018, exceeding the high end of guidance
- System-wide comparable RevPAR increased 1.4 percent on a currency neutral basis for the second quarter from the same period in 2018
- Approved 28,100 new rooms for development during the second quarter, growing Hilton's development pipeline to approximately 373,000 rooms as of June 30, 2019
- Opened 17,100 rooms in the second quarter, contributing to 15,700 net additional rooms, on track to deliver approximately 6.5 percent net unit growth for the full year
- Repurchased 4.2 million shares of Hilton common stock during the second quarter, bringing total capital return, including dividends, to approximately $426 million for the quarter and $766 million year to date through June
- Issued $1.0 billion aggregate principal amount of 4.875% Senior Notes due 2030 and repaid $500 million on the Term Loans, bringing the outstanding balance down to $2.6 billion
- Refinanced and extended the senior secured credit facilities, upsizing the Revolving Credit Facility to $1.75 billion and lengthening Hilton's weighted average maturity to over seven years
- Full year system-wide comparable RevPAR is expected to increase between 1.0 percent and 2.0 percent on a currency neutral basis; full year net income is projected to be between $887 million and $909 million; full year Adjusted EBITDA is projected to be between $2,280 million and $2,310 million
- Full year 2019 capital return is projected to be between $1.5 billion and $1.8 billion
Overview
Christopher J. Nassetta, President & Chief Executive Officer of Hilton, said, "We are pleased with our strong second quarter results, which exceeded the high end of guidance for Adjusted EBITDA and diluted EPS, adjusted for special items, driven by our resilient business model and strong net unit growth. We continued to experience meaningful market share gains during the quarter with increases across all brands and regions, further growing our industry-leading RevPAR index premium. As we look to the remainder of the year, we think we are well-positioned to continue driving growth ahead of the industry."
For the three and six months ended June 30, 2019, system-wide comparable RevPAR grew 1.4 percent and 1.6 percent, respectively, driven by increases in both ADR and occupancy. Management and franchise fee revenues increased 8 percent and 10 percent during the three and six months ended June 30, 2019, respectively, as a result of RevPAR growth at comparable managed and franchised hotels of 1.3 percent and 1.6 percent, respectively, increased licensing and other fees and the addition of new properties to Hilton's portfolio.
For the three months ended June 30, 2019, diluted EPS was $0.89 and diluted EPS, adjusted for special items, was $1.06 compared to $0.71 and $0.86, respectively, for the three months ended June 30, 2018. Net income and Adjusted EBITDA were $261 million and $618 million, respectively, for the three months ended June 30, 2019, compared to $217 million and $555 million, respectively, for the three months ended June 30, 2018.
For the six months ended June 30, 2019, diluted EPS was $1.42 and diluted EPS, adjusted for special items, was $1.85 compared to $1.21 and $1.55, respectively, for the six months ended June 30, 2018. Net income and Adjusted EBITDA were $420 million and $1,117 million, respectively, for the six months ended June 30, 2019, compared to $380 million and $1,000 million, respectively, for the six months ended June 30, 2018.
Development
In the second quarter of 2019, Hilton opened 123 new hotels totaling 17,100 rooms and achieved net unit growth of 15,700 rooms, contributing to a 7 percent net unit growth from June 30, 2018.
As of June 30, 2019, Hilton's development pipeline totaled nearly 2,490 hotels consisting of approximately 373,000 rooms throughout 109 countries and territories, including 37 countries and territories where Hilton does not currently have any open hotels. Additionally, 201,000 rooms in the development pipeline were located outside the U.S., and 192,000 rooms, or more than half, were under construction.
Hilton continues to expand its luxury brand presence, with the recent openings of the Waldorf Astoria Dubai International Finance Centre and the Waldorf Astoria Maldives Ithaafushi, and remains on track to grow its luxury portfolio by 17 percent in 2019.
Balance Sheet and Liquidity
In June 2019, Hilton issued $1.0 billion aggregate principal amount of 4.875% Senior Notes due 2030 and used a portion of the net proceeds from the issuance to repay $500 million outstanding under its senior secured term loan facility ("Term Loans"), resulting in a remaining balance of $2.6 billion. Additionally, Hilton amended its senior secured revolving credit facility ("Revolving Credit Facility") to increase the borrowing capacity to $1.75 billion and extend the maturity date to 2024, and extended the maturity of the remaining outstanding Term Loans to 2026.
As of June 30, 2019, Hilton had $7.9 billion of long-term debt outstanding, excluding deferred financing costs and discount, with a weighted average interest rate of 4.52 percent. Excluding finance lease liabilities and other debt of Hilton's consolidated variable interest entities, Hilton had $7.6 billion of long-term debt outstanding with a weighted average interest rate of 4.48 percent.
Total cash and cash equivalents were $718 million as of June 30, 2019, including $83 million of restricted cash and cash equivalents. No amounts were outstanding under the $1.75 billion Revolving Credit Facility as of June 30, 2019.
During the second quarter of 2019, Hilton repurchased 4.2 million shares of its common stock at a cost of approximately $383 million and an average price per share of $91.65. During the six months ended June 30, 2019, Hilton repurchased 8.1 million shares of its common stock at a cost of approximately $679 million and an average price per share of $84.44. From the inception of Hilton's stock repurchase program in March 2017, Hilton has repurchased approximately 46.1 million shares of its common stock for approximately $3.4 billion at an average price per share of $73.47. The amount remaining under Hilton's stock repurchase program is approximately $1.3 billion.
In June 2019, Hilton paid a quarterly cash dividend of $0.15 per share on shares of its common stock, for a total of $43 million, bringing year to date dividends to $87 million. In July 2019, Hilton's board of directors authorized a regular quarterly cash dividend of $0.15 per share of common stock to be paid on or before September 27, 2019 to holders of record of its common stock as of the close of business on August 9, 2019.
Adoption of New Accounting Standard
On January 1, 2019, the Company adopted Accounting Standards Update ("ASU") No. 2016-02 Leases (Topic 842) ("ASU 2016-02"). As permitted, the Company has applied this ASU at the adoption date; therefore, the presentation of financial information for all periods prior to January 1, 2019 remains unchanged and in accordance with Leases (Topic 840). For additional information on the effect of this ASU, refer to Hilton's Quarterly Report on Form 10-Q for the quarterly period ended June 30, 2019, which is expected to be filed on or about the date of this press release.
Outlook
Share-based metrics in Hilton's outlook include actual share repurchases to date, but do not include the effect of potential share repurchases hereafter.
Full Year 2019
- System-wide comparable RevPAR is expected to increase between 1.0 percent and 2.0 percent on a currency neutral basis compared to 2018.
- Diluted EPS, before special items, is projected to be between $3.02 and $3.09.
- Diluted EPS, adjusted for special items, is projected to be between $3.78 and $3.85.
- Net income is projected to be between $887 million and $909 million.
- Adjusted EBITDA is projected to be between $2,280 million and $2,310 million.
- Management and franchise fee revenue is projected to increase between 7 percent and 9 percent compared to 2018.
- Contract acquisition costs and capital expenditures, excluding amounts indirectly reimbursed by hotel owners, are expected to be between $175 million and $200 million.
- Capital return is projected to be between $1.5 billion and $1.8 billion.
- General and administrative expenses are projected to be between $430 million and $450 million.
- Net unit growth is expected to be approximately 6.5 percent.
Third Quarter 2019
- System-wide comparable RevPAR is expected to increase between 1.0 percent and 2.0 percent on a currency neutral basis compared to the third quarter of 2018.
- Diluted EPS, before special items, is projected to be between $0.82 and $0.87.
- Diluted EPS, adjusted for special items, is projected to be between $0.98 and $1.03.
- Net income is projected to be between $239 million and $253 million.
- Adjusted EBITDA is projected to be between $590 million and $610 million.
- Management and franchise fee revenue is projected to increase between 6 percent and 8 percent compared to the third quarter of 2018.
Conference Call
Hilton will host a conference call to discuss second quarter 2019 results on July 24, 2019 at 10:00 a.m. Eastern Time. Participants may listen to the live webcast by logging on to the Hilton Investor Relations website at https://ir.hilton.com/events-and-presentations. A replay and transcript of the webcast will be available within 24 hours after the live event at https://ir.hilton.com/financial-reporting/quarterly-results/2019.
Alternatively, participants may listen to the live call by dialing 1-888-317-6003 in the United States ("U.S") or 1-412-317-6061 internationally using the conference ID 0505153. Participants are encouraged to dial into the call or link to the webcast at least fifteen minutes prior to the scheduled start time. A telephone replay will be available for seven days following the call. To access the telephone replay, dial 1-877-344-7529 in the U.S. or 1-412-317-0088 internationally using the conference ID 10132755.
Forward-Looking Statements
This press release contains forward-looking statements within the meaning of Section 27A of the Securities Act of 1933, as amended, and Section 21E of the Securities Exchange Act of 1934, as amended. These statements include, but are not limited to, statements related to the expectations regarding the performance of Hilton's business, financial results, liquidity and capital resources and other non-historical statements, including the statements in the "Outlook" section of this press release. In some cases, these forward-looking statements can be identified by the use of words such as "outlook," "believes," "expects," "potential," "continues," "may," "will," "should," "could," "seeks," "projects," "predicts," "intends," "plans," "estimates," "anticipates" or the negative version of these words or other comparable words. Such forward-looking statements are subject to various risks and uncertainties, including, among others, risks inherent to the hospitality industry, macroeconomic factors beyond Hilton's control, competition for hotel guests and management and franchise contracts, risks related to doing business with third-party hotel owners, performance of Hilton's information technology systems, growth of reservation channels outside of Hilton's system, risks of doing business outside of the U.S. and Hilton's indebtedness. Additional factors that could cause Hilton's results to differ materially from those described in the forward-looking statements can be found under the section entitled "Part I—Item 1A. Risk Factors" of Hilton's Annual Report on Form 10-K for the fiscal year ended December 31, 2018, filed with the Securities and Exchange Commission ("SEC"), as such factors may be updated from time to time in Hilton's periodic filings with the SEC, which are accessible on the SEC's website at www.sec.gov. Accordingly, there are or will be important factors that could cause actual outcomes or results to differ materially from those indicated in these statements. These factors should not be construed as exhaustive and should be read in conjunction with the other cautionary statements that are included in this press release and in Hilton's filings with the SEC. The Company undertakes no obligation to publicly update or review any forward-looking statement, whether as a result of new information, future developments or otherwise, except as required by law.
Non-GAAP Financial Measures
The Company refers to certain financial measures that are not recognized under U.S. generally accepted accounting principles ("GAAP") in this press release, including: net income, adjusted for special items; diluted EPS, adjusted for special items; Adjusted EBITDA; Adjusted EBITDA margin; net debt; and net debt to Adjusted EBITDA ratio. See the schedules to this press release, including the "Definitions" section, for additional information and reconciliations of such non-GAAP financial measures.
About Hilton
Hilton (NYSE: HLT) is a leading global hospitality company, with a portfolio of 17 world-class brands comprising nearly 5,900 properties with more than 939,000 rooms, in 114 countries and territories. Dedicated to fulfilling its mission to be the world's most hospitable company, Hilton earned a spot on the 2018 world's best workplaces list, and has welcomed more than 3 billion guests during its 100-year history. Through the award-winning guest loyalty program Hilton Honors, more than 94 million members who book directly with Hilton can earn Points for hotel stays and experiences money can't buy, plus enjoy instant benefits, including digital check-in with room selection, Digital Key, and Connected Room. Visit newsroom.hilton.com for more information, and connect with Hilton on facebook.com/hiltonnewsroom, twitter.com/hiltonnewsroom, linkedIn.com/company/hilton, instagram.com/hiltonnewsroom and youtube.com/hiltonnewsroom.
HILTON WORLDWIDE HOLDINGS INC. EARNINGS RELEASE SCHEDULES TABLE OF CONTENTS |
Condensed Consolidated Statements of Operations |
Comparable and Currency Neutral System-Wide Hotel Operating Statistics |
Property Summary |
Capital Expenditures and Contract Acquisition Costs |
Non-GAAP Financial Measures Reconciliations |
Definitions |
HILTON WORLDWIDE HOLDINGS INC.
| |||||||||||||||
Three Months Ended | Six Months Ended | ||||||||||||||
June 30, | June 30, | ||||||||||||||
2019 | 2018 | 2019 | 2018 | ||||||||||||
Revenues | |||||||||||||||
Franchise and licensing fees | $ | 444 | $ | 404 | $ | 826 | $ | 735 | |||||||
Base and other management fees | 89 | 84 | 169 | 161 | |||||||||||
Incentive management fees | 58 | 59 | 113 | 114 | |||||||||||
Owned and leased hotels | 387 | 392 | 699 | 726 | |||||||||||
Other revenues | 26 | 22 | 52 | 45 | |||||||||||
1,004 | 961 | 1,859 | 1,781 | ||||||||||||
Other revenues from managed and franchised properties | 1,480 | 1,330 | 2,829 | 2,584 | |||||||||||
Total revenues | 2,484 | 2,291 | 4,688 | 4,365 | |||||||||||
Expenses | |||||||||||||||
Owned and leased hotels | 334 | 352 | 632 | 672 | |||||||||||
Depreciation and amortization | 86 | 79 | 170 | 161 | |||||||||||
General and administrative | 113 | 115 | 220 | 219 | |||||||||||
Other expenses | 15 | 12 | 35 | 26 | |||||||||||
548 | 558 | 1,057 | 1,078 | ||||||||||||
Other expenses from managed and franchised properties | 1,458 | 1,327 | 2,841 | 2,602 | |||||||||||
Total expenses | 2,006 | 1,885 | 3,898 | 3,680 | |||||||||||
Operating income | 478 | 406 | 790 | 685 | |||||||||||
Interest expense | (101 | ) | (95 | ) | (199 | ) | (178 | ) | |||||||
Loss on foreign currency transactions | (3 | ) | (12 | ) | (3 | ) | (1 | ) | |||||||
Other non-operating income (loss), net | (12 | ) | (1 | ) | (8 | ) | 13 | ||||||||
Income before income taxes | 362 | 298 | 580 | 519 | |||||||||||
Income tax expense | (101 | ) | (81 | ) | (160 | ) | (139 | ) | |||||||
Net income | 261 | 217 | 420 | 380 | |||||||||||
Net income attributable to noncontrolling interests | (1 | ) | — | (2 | ) | (2 | ) | ||||||||
Net income attributable to Hilton stockholders | $ | 260 | $ | 217 | $ | 418 | $ | 378 | |||||||
Weighted average shares outstanding: | |||||||||||||||
Basic | 290 | 301 | 291 | 308 | |||||||||||
Diluted | 292 | 303 | 294 | 311 | |||||||||||
Earnings per share: | |||||||||||||||
Basic | $ | 0.90 | $ | 0.72 | $ | 1.43 | $ | 1.22 | |||||||
Diluted | $ | 0.89 | $ | 0.71 | $ | 1.42 | $ | 1.21 | |||||||
Cash dividends declared per share | $ | 0.15 | $ | 0.15 | $ | 0.30 | $ | 0.30 | |||||||
HILTON WORLDWIDE HOLDINGS INC.
(unaudited) | ||||||||||||||||||||
Three Months Ended June 30, | ||||||||||||||||||||
Occupancy | ADR | RevPAR | ||||||||||||||||||
2019 | vs. 2018 | 2019 | vs. 2018 | 2019 | vs. 2018 | |||||||||||||||
U.S. | 80.7 | % | 0.2 | % pts. | $ | 152.75 | 0.7 | % | $ | 123.32 | 1.0 | % | ||||||||
Americas (excluding U.S.) | 72.2 | 1.0 | 123.37 | 1.9 | 89.09 | 3.3 | ||||||||||||||
Europe | 80.6 | 2.0 | 147.36 | 2.4 | 118.77 | 5.0 | ||||||||||||||
Middle East & Africa | 70.8 | 2.5 | 153.48 | (3.3 | ) | 108.62 | 0.2 | |||||||||||||
Asia Pacific | 72.0 | 0.9 | 123.25 | 0.7 | 88.76 | 2.0 | ||||||||||||||
System-wide | 79.4 | 0.5 | 148.93 | 0.7 | 118.27 | 1.4 | ||||||||||||||
Six Months Ended June 30, | ||||||||||||||||||||
Occupancy | ADR | RevPAR | ||||||||||||||||||
2019 | vs. 2018 | 2019 | vs. 2018 | 2019 | vs. 2018 | |||||||||||||||
U.S. | 76.6 | % | 0.4 | % pts. | $ | 150.35 | 0.9 | % | $ | 115.09 | 1.4 | % | ||||||||
Americas (excluding U.S.) | 69.4 | 1.0 | 124.84 | 2.6 | 86.59 | 4.1 | ||||||||||||||
Europe | 74.8 | 0.9 | 138.55 | 2.9 | 103.64 | 4.2 | ||||||||||||||
Middle East & Africa | 73.0 | 2.6 | 147.03 | (6.3 | ) | 107.32 | (2.8 | ) | ||||||||||||
Asia Pacific | 70.5 | 1.3 | 126.03 | (0.4 | ) | 88.88 | 1.6 | |||||||||||||
System-wide | 75.5 | 0.6 | 146.33 | 0.9 | 110.48 | 1.6 | ||||||||||||||
HILTON WORLDWIDE HOLDINGS INC.
| |||||||||||||||||||
Three Months Ended June 30, | |||||||||||||||||||
Occupancy | ADR | RevPAR | |||||||||||||||||
2019 | vs. 2018 | 2019 | vs. 2018 | 2019 | vs. 2018 | ||||||||||||||
Waldorf Astoria Hotels & Resorts | 73.4 | % | 1.3 | % pts. | $ | 367.61 | 3.3 | % | $ | 269.84 | 5.2 | % | |||||||
Conrad Hotels & Resorts | 76.2 | 4.2 | 279.32 | 2.9 | 212.91 | 8.9 | |||||||||||||
Hilton Hotels & Resorts | 79.4 | 0.7 | 175.44 | 1.1 | 139.31 | 2.0 | |||||||||||||
Curio Collection by Hilton | 76.2 | 0.9 | 221.50 | 3.9 | 168.71 | 5.1 | |||||||||||||
DoubleTree by Hilton | 77.3 | 0.2 | 134.84 | (0.1 | ) | 104.24 | 0.1 | ||||||||||||
Embassy Suites by Hilton | 82.1 | 0.3 | 168.37 | 0.8 | 138.22 | 1.1 | |||||||||||||
Hilton Garden Inn | 79.8 | 0.7 | 136.75 | 0.2 | 109.11 | 1.1 | |||||||||||||
Hampton by Hilton | 78.6 | 0.2 | 125.50 | 0.4 | 98.68 | 0.7 | |||||||||||||
Tru by Hilton | 73.4 | 0.8 | 109.04 | 4.4 | 80.05 | 5.6 | |||||||||||||
Homewood Suites by Hilton | 84.3 | 0.3 | 144.79 | 0.4 | 122.06 | 0.7 | |||||||||||||
Home2 Suites by Hilton | 83.7 | 3.1 | 120.75 | 0.9 | 101.04 | 4.7 | |||||||||||||
System-wide | 79.4 | 0.5 | 148.93 | 0.7 | 118.27 | 1.4 | |||||||||||||
Six Months Ended June 30, | |||||||||||||||||||
Occupancy | ADR | RevPAR | |||||||||||||||||
2019 | vs. 2018 | 2019 | vs. 2018 | 2019 | vs. 2018 | ||||||||||||||
Waldorf Astoria Hotels & Resorts | 72.3 | % | 0.7 | % pts. | $ | 379.25 | 1.7 | % | $ | 274.06 | 2.7 | % | |||||||
Conrad Hotels & Resorts | 75.1 | 4.3 | 273.05 | 0.9 | 204.94 | 7.0 | |||||||||||||
Hilton Hotels & Resorts | 76.0 | 0.5 | 172.73 | 1.3 | 131.29 | 1.9 | |||||||||||||
Curio Collection by Hilton | 72.7 | (0.1 | ) | 220.23 | 4.3 | 160.14 | 4.2 | ||||||||||||
DoubleTree by Hilton | 73.8 | 0.2 | 132.78 | 0.2 | 98.02 | 0.5 | |||||||||||||
Embassy Suites by Hilton | 79.1 | 0.6 | 166.27 | 1.1 | 131.45 | 1.9 | |||||||||||||
Hilton Garden Inn | 75.8 | 0.7 | 132.49 | 0.5 | 100.40 | 1.4 | |||||||||||||
Hampton by Hilton | 73.7 | 0.4 | 122.25 | 0.5 | 90.10 | 1.1 | |||||||||||||
Tru by Hilton | 68.3 | 2.8 | 104.72 | 3.9 | 71.50 | 8.3 | |||||||||||||
Homewood Suites by Hilton | 80.7 | 0.4 | 141.69 | 0.6 | 114.38 | 1.1 | |||||||||||||
Home2 Suites by Hilton | 79.5 | 3.5 | 117.94 | 0.9 | 93.77 | 5.5 | |||||||||||||
System-wide | 75.5 | 0.6 | 146.33 | 0.9 | 110.48 | 1.6 | |||||||||||||
HILTON WORLDWIDE HOLDINGS INC.
| ||||||||||||||||||||
Three Months Ended June 30, | ||||||||||||||||||||
Occupancy | ADR | RevPAR | ||||||||||||||||||
2019 | vs. 2018 | 2019 | vs. 2018 | 2019 | vs. 2018 | |||||||||||||||
Management and franchise | 79.4 | % | 0.5 | % pts. | $ | 147.74 | 0.6 | % | $ | 117.27 | 1.3 | % | ||||||||
Ownership(1) | 80.8 | 0.4 | 201.38 | 5.1 | 162.72 | 5.7 | ||||||||||||||
System-wide | 79.4 | 0.5 | 148.93 | 0.7 | 118.27 | 1.4 | ||||||||||||||
Six Months Ended June 30, | ||||||||||||||||||||
Occupancy | ADR | RevPAR | ||||||||||||||||||
2019 | vs. 2018 | 2019 | vs. 2018 | 2019 | vs. 2018 | |||||||||||||||
Management and franchise | 75.5 | % | 0.6 | % pts. | $ | 145.34 | 0.8 | % | $ | 109.72 | 1.6 | % | ||||||||
Ownership(1) | 75.8 | 0.1 | 190.41 | 4.3 | 144.30 | 4.4 | ||||||||||||||
System-wide | 75.5 | 0.6 | 146.33 | 0.9 | 110.48 | 1.6 | ||||||||||||||
_______________ | |
(1) | Includes owned and leased hotels, as well as hotels owned or leased by entities in which Hilton owns a noncontrolling financial interest. |
HILTON WORLDWIDE HOLDINGS INC.
| |||||||||||||||
Owned / Leased(1) | Managed | Franchised | Total | ||||||||||||
Properties | Rooms | Properties | Rooms | Properties | Rooms | Properties | Rooms | ||||||||
Waldorf Astoria Hotels & Resorts | |||||||||||||||
U.S. | — | — | 15 | 6,171 | — | — | 15 | 6,171 | |||||||
Americas (excluding U.S.) | — | — | 1 | 142 | 1 | 984 | 2 | 1,126 | |||||||
Europe | 2 | 463 | 4 | 898 | — | — | 6 | 1,361 | |||||||
Middle East & Africa | — | — | 5 | 1,224 | — | — | 5 | 1,224 | |||||||
Asia Pacific | — | — | 4 | 896 | — | — | 4 | 896 | |||||||
LXR Hotels & Resorts | |||||||||||||||
Middle East & Africa | — | — | — | — | 1 | 234 | 1 | 234 | |||||||
Conrad Hotels & Resorts | |||||||||||||||
U.S. | — | — | 5 | 1,649 | 1 | 230 | 6 | 1,879 | |||||||
Americas (excluding U.S.) | — | — | 2 | 402 | — | — | 2 | 402 | |||||||
Europe | — | — | 4 | 1,155 | — | — | 4 | 1,155 | |||||||
Middle East & Africa | 1 | 614 | 2 | 993 | — | — | 3 | 1,607 | |||||||
Asia Pacific | 1 | 164 | 18 | 5,360 | 1 | 654 | 20 | 6,178 | |||||||
Canopy by Hilton | |||||||||||||||
U.S. | — | — | — | — | 6 | 1,014 | 6 | 1,014 | |||||||
Europe | — | — | — | — | 2 | 263 | 2 | 263 | |||||||
Asia Pacific | — | — | 1 | 150 | — | — | 1 | 150 | |||||||
Hilton Hotels & Resorts | |||||||||||||||
U.S. | — | — | 66 | 48,235 | 178 | 54,639 | 244 | 102,874 | |||||||
Americas (excluding U.S.) | 1 | 405 | 26 | 9,534 | 21 | 7,085 | 48 | 17,024 | |||||||
Europe | 50 | 13,843 | 46 | 14,792 | 37 | 10,432 | 133 | 39,067 | |||||||
Middle East & Africa | 5 | 1,998 | 43 | 13,299 | 3 | 1,609 | 51 | 16,906 | |||||||
Asia Pacific | 7 | 3,441 | 94 | 34,066 | 8 | 3,279 | 109 | 40,786 | |||||||
Curio Collection by Hilton | |||||||||||||||
U.S. | — | — | 5 | 2,335 | 38 | 7,783 | 43 | 10,118 | |||||||
Americas (excluding U.S.) | — | — | — | — | 8 | 1,110 | 8 | 1,110 | |||||||
Europe | — | — | 3 | 270 | 13 | 1,572 | 16 | 1,842 | |||||||
Middle East & Africa | — | — | 2 | 255 | 1 | 356 | 3 | 611 | |||||||
Asia Pacific | — | — | 3 | 663 | 1 | 50 | 4 | 713 | |||||||
DoubleTree by Hilton | |||||||||||||||
U.S. | — | — | 33 | 11,215 | 321 | 74,730 | 354 | 85,945 | |||||||
Americas (excluding U.S.) | — | — | 1 | 172 | 28 | 5,868 | 29 | 6,040 | |||||||
Europe | — | — | 13 | 3,451 | 95 | 16,075 | 108 | 19,526 | |||||||
Middle East & Africa | — | — | 10 | 2,349 | 6 | 718 | 16 | 3,067 | |||||||
Asia Pacific | — | — | 57 | 15,804 | 3 | 1,072 | 60 | 16,876 | |||||||
Tapestry Collection by Hilton | |||||||||||||||
U.S. | — | — | — | — | 23 | 3,182 | 23 | 3,182 | |||||||
Embassy Suites by Hilton | |||||||||||||||
U.S. | — | — | 42 | 11,115 | 203 | 45,776 | 245 | 56,891 | |||||||
Americas (excluding U.S.) | — | — | 3 | 667 | 5 | 1,330 | 8 | 1,997 | |||||||
Hilton Garden Inn | |||||||||||||||
U.S. | — | — | 6 | 637 | 669 | 92,744 | 675 | 93,381 | |||||||
Americas (excluding U.S.) | — | — | 11 | 1,561 | 41 | 6,379 | 52 | 7,940 | |||||||
Europe | — | — | 22 | 4,040 | 47 | 7,774 | 69 | 11,814 | |||||||
Middle East & Africa | — | — | 14 | 2,887 | 2 | 271 | 16 | 3,158 | |||||||
Asia Pacific | — | — | 29 | 6,261 | — | — | 29 | 6,261 | |||||||
Hampton by Hilton | |||||||||||||||
U.S. | — | — | 45 | 5,495 | 2,162 | 211,798 | 2,207 | 217,293 | |||||||
Americas (excluding U.S.) | — | — | 13 | 1,685 | 97 | 11,617 | 110 | 13,302 | |||||||
Europe | — | — | 18 | 2,956 | 68 | 10,560 | 86 | 13,516 | |||||||
Middle East & Africa | — | — | 1 | 420 | — | — | 1 | 420 | |||||||
Asia Pacific | — | — | — | — | 87 | 14,626 | 87 | 14,626 | |||||||
Tru by Hilton | |||||||||||||||
U.S. | — | — | — | — | 76 | 7,277 | 76 | 7,277 | |||||||
Americas (excluding U.S.) | — | — | — | — | 1 | 90 | 1 | 90 | |||||||
Homewood Suites by Hilton | |||||||||||||||
U.S. | — | — | 17 | 1,826 | 451 | 51,531 | 468 | 53,357 | |||||||
Americas (excluding U.S.) | — | — | 2 | 261 | 22 | 2,456 | 24 | 2,717 | |||||||
Home2 Suites by Hilton | |||||||||||||||
U.S. | — | — | 2 | 198 | 323 | 33,717 | 325 | 33,915 | |||||||
Americas (excluding U.S.) | — | — | — | — | 7 | 753 | 7 | 753 | |||||||
Other | — | — | 3 | 1,450 | 2 | 876 | 5 | 2,326 | |||||||
Hotels | 67 | 20,928 | 691 | 216,939 | 5,059 | 692,514 | 5,817 | 930,381 | |||||||
Hilton Grand Vacations | — | — | — | — | 55 | 8,916 | 55 | 8,916 | |||||||
Total | 67 | 20,928 | 691 | 216,939 | 5,114 | 701,430 | 5,872 | 939,297 | |||||||
_______________ | |
(1) | Includes hotels owned or leased by entities in which Hilton owns a noncontrolling financial interest. |
HILTON WORLDWIDE HOLDINGS INC. | ||||||||||
CAPITAL EXPENDITURES AND CONTRACT ACQUISITION COSTS | ||||||||||
(unaudited, dollars in millions) | ||||||||||
Three Months Ended
| Increase / (Decrease) | |||||||||
2019 | 2018 | $ | % | |||||||
Capital expenditures for property and equipment(1) | $ | 23 | $ | 18 | 5 | 27.8 | ||||
Capitalized software costs(2) | 25 | 23 | 2 | 8.7 | ||||||
Total capital expenditures | 48 | 41 | 7 | 17.1 | ||||||
Contract acquisition costs | 28 | 24 | 4 | 16.7 | ||||||
Total capital expenditures and contract acquisition costs | $ | 76 | $ | 65 | 11 | 16.9 | ||||
Six Months Ended
| Increase / (Decrease) | |||||||||
2019 | 2018 | $ | % | |||||||
Capital expenditures for property and equipment(1) | $ | 46 | $ | 28 | 18 | 64.3 | ||||
Capitalized software costs(2) | 44 | 38 | 6 | 15.8 | ||||||
Total capital expenditures | 90 | 66 | 24 | 36.4 | ||||||
Contract acquisition costs | 43 | 38 | 5 | 13.2 | ||||||
Total capital expenditures and contract acquisition costs | $ | 133 | $ | 104 | 29 | 27.9 | ||||
_______________ | |
(1) | Includes expenditures for hotels, corporate and other property and equipment, of which $1 million and $2 million were indirectly reimbursed by hotel owners for the three months ended June 30, 2019 and 2018, respectively, and $6 million and $4 million were indirectly reimbursed for the six months ended June 30, 2019 and 2018, respectively. Excludes expenditures for furniture, fixtures and equipment ("FF&E") replacement reserves of $15 million for the three months ended June 30, 2019 and 2018 and $29 million and $27 million for the six months ended June 30, 2019 and 2018, respectively. |
(2) | Includes $21 million and $18 million of expenditures that were indirectly reimbursed by hotel owners for the three months ended June 30, 2019 and 2018, respectively, and $36 million and $25 million for the six months ended June 30, 2019 and 2018, respectively. |
HILTON WORLDWIDE HOLDINGS INC.
| |||||||||||||||
Three Months Ended | Six Months Ended | ||||||||||||||
June 30, | June 30, | ||||||||||||||
2019 | 2018 | 2019 | 2018 | ||||||||||||
Net income attributable to Hilton stockholders, as reported | $ | 260 | $ | 217 | $ | 418 | $ | 378 | |||||||
Diluted EPS, as reported | $ | 0.89 | $ | 0.71 | $ | 1.42 | $ | 1.21 | |||||||
Special items: | |||||||||||||||
Net other expenses (revenues) from managed and franchised properties | $ | (22 | ) | $ | (3 | ) | $ | 12 | $ | 18 | |||||
Purchase accounting amortization(1) | 51 | 52 | 102 | 103 | |||||||||||
FF&E replacement reserves | 15 | 15 | 29 | 27 | |||||||||||
Financing transactions(2) | 8 | 7 | 8 | 7 | |||||||||||
Tax-related adjustments(3) | — | (11 | ) | — | (11 | ) | |||||||||
Other adjustments(4) | 9 | 1 | 10 | (3 | ) | ||||||||||
Total special items before tax | 61 | 61 | 161 | 141 | |||||||||||
Income tax expense on special items | (11 | ) | (18 | ) | (35 | ) | (38 | ) | |||||||
Total special items after tax | $ | 50 | $ | 43 | $ | 126 | $ | 103 | |||||||
Net income, adjusted for special items | $ | 310 | $ | 260 | $ | 544 | $ | 481 | |||||||
Diluted EPS, adjusted for special items | $ | 1.06 | $ | 0.86 | $ | 1.85 | $ | 1.55 | |||||||
_______________ | |
(1) | Represents the amortization of intangible assets that were recorded at their fair value in October 2007 when the Company became a wholly owned subsidiary of affiliates of The Blackstone Group Inc. (formerly known as The Blackstone Group L.P.) (the "Merger"). |
(2) | Includes expenses recognized in connection with the June 2019 and April 2018 refinancings and repayments of the senior secured credit facilities that were recognized in other non-operating income (loss), net. |
(3) | Includes a tax benefit to adjust a provisional amount recognized in relation to the Tax Cuts and Jobs Act enacted in December 2017, which did not have an effect on cash paid for taxes in the periods. |
(4) | Includes severance costs related to the 2015 sale of the Waldorf Astoria New York that were recognized in general and administrative expenses. The three and six months ended June 30, 2019 also include a loss on the disposal of a real estate investment recognized in other non-operating income (loss), net and impairment losses. Additionally, the six months ended June 30, 2018 includes a gain on the refinancing of a loan Hilton issued to finance the construction of a hotel that Hilton manages, which was recognized in other non-operating income (loss), net. |
HILTON WORLDWIDE HOLDINGS INC.
| |||||||||||||||
Three Months Ended | Six Months Ended | ||||||||||||||
June 30, | June 30, | ||||||||||||||
2019 | 2018 | 2019 | 2018 | ||||||||||||
Net income | $ | 261 | $ | 217 | $ | 420 | $ | 380 | |||||||
Interest expense | 101 | 95 | 199 | 178 | |||||||||||
Income tax expense | 101 | 81 | 160 | 139 | |||||||||||
Depreciation and amortization | 86 | 79 | 170 | 161 | |||||||||||
EBITDA | 549 | 472 | 949 | 858 | |||||||||||
Loss on foreign currency transactions | 3 | 12 | 3 | 1 | |||||||||||
FF&E replacement reserves | 15 | 15 | 29 | 27 | |||||||||||
Share-based compensation expense | 47 | 40 | 81 | 68 | |||||||||||
Amortization of contract acquisition costs | 7 | 7 | 14 | 14 | |||||||||||
Net other expenses (revenues) from managed and franchised properties | (22 | ) | (3 | ) | 12 | 18 | |||||||||
Other adjustment items(1) | 19 | 12 | 29 | 14 | |||||||||||
Adjusted EBITDA | $ | 618 | $ | 555 | $ | 1,117 | $ | 1,000 | |||||||
_______________ | |
(1) | Includes adjustments for expenses recognized in connection with the refinancings and repayments of the senior secured credit facilities, severance and other items. |
Three Months Ended | Six Months Ended | ||||||||||||||
June 30, | June 30, | ||||||||||||||
2019 | 2018 | 2019 | 2018 | ||||||||||||
Total revenues, as reported | $ | 2,484 | $ | 2,291 | $ | 4,688 | $ | 4,365 | |||||||
Add: amortization of contract acquisition costs | 7 | 7 | 14 | 14 | |||||||||||
Less: other revenues from managed and franchised properties | (1,480 | ) | (1,330 | ) | (2,829 | ) | (2,584 | ) | |||||||
Total revenues, as adjusted | $ | 1,011 | $ | 968 | $ | 1,873 | $ | 1,795 | |||||||
Adjusted EBITDA | $ | 618 | $ | 555 | $ | 1,117 | $ | 1,000 | |||||||
Adjusted EBITDA margin | 61.1 | % | 57.3 | % | 59.6 | % | 55.7 | % | |||||||
HILTON WORLDWIDE HOLDINGS INC.
| |||||||||||
June 30, | December 31, | ||||||||||
2019 | 2018 | ||||||||||
Long-term debt, including current maturities | $ | 7,809 | $ | 7,282 | |||||||
Add: unamortized deferred financing costs and discount | 88 | 79 | |||||||||
Long-term debt, including current maturities and excluding unamortized deferred financing costs and discount | 7,897 | 7,361 | |||||||||
Add: Hilton's share of unconsolidated affiliate debt, excluding unamortized deferred financing costs | 3 | 15 | |||||||||
Less: cash and cash equivalents | (635) | (403) | |||||||||
Less: restricted cash and cash equivalents | (83) | (81) | |||||||||
Net debt | $ | 7,182 | $ | 6,892 | |||||||
Six Months Ended | Year Ended | TTM(1) | |||||||||
June 30, | December 31, | June 30, | |||||||||
2019 | 2018 | 2018 | 2019 | ||||||||
Net income | $ | 420 | $ | 380 | $ | 769 | $ | 809 | |||
Interest expense | 199 | 178 | 371 | 392 | |||||||
Income tax expense | 160 | 139 | 309 | 330 | |||||||
Depreciation and amortization | 170 | 161 | 325 | 334 | |||||||
EBITDA | 949 | 858 | 1,774 | 1,865 | |||||||
Loss on foreign currency transactions | 3 | 1 | 11 | 13 | |||||||
FF&E replacement reserves | 29 | 27 | 50 | 52 | |||||||
Share-based compensation expense | 81 | 68 | 127 | 140 | |||||||
Amortization of contract acquisition costs | 14 | 14 | 27 | 27 | |||||||
Net other expenses from managed and franchised properties | 12 | 18 | 85 | 79 | |||||||
Other adjustment items(2) | 29 | 14 | 27 | 42 | |||||||
Adjusted EBITDA | $ | 1,117 | $ | 1,000 | $ | 2,101 | $ | 2,218 | |||
Net debt | $ | 7,182 | |||||||||
Net debt to Adjusted EBITDA ratio | 3.2 | ||||||||||
_______________ | |
(1) | Trailing twelve months ("TTM") June 30, 2019 is calculated as the six months ended June 30, 2019 plus the year ended December 31, 2018 less the six months ended June 30, 2018. |
(2) | Includes adjustments for expenses recognized in connection with the refinancings and repayments of the senior secured credit facilities, severance and other items. |
HILTON WORLDWIDE HOLDINGS INC. | |||||||
NON-GAAP FINANCIAL MEASURES RECONCILIATIONS | |||||||
OUTLOOK: NET INCOME AND DILUTED EPS, ADJUSTED FOR SPECIAL ITEMS | |||||||
FORECASTED 2019 | |||||||
(unaudited, in millions, except per share data) | |||||||
Three Months Ending | |||||||
September 30, 2019 | |||||||
Low Case | High Case | ||||||
Net income attributable to Hilton stockholders, before special items | $ | 237 | $ | 251 | |||
Diluted EPS, before special items(1) | $ | 0.82 | $ | 0.87 | |||
Special items(2): | |||||||
Purchase accounting amortization | $ | 51 | $ | 51 | |||
FF&E replacement reserves | 16 | 16 | |||||
Total special items before tax | 67 | 67 | |||||
Income tax expense on special items | (19 | ) | (19 | ) | |||
Total special items after tax | $ | 48 | $ | 48 | |||
Net income, adjusted for special items | $ | 285 | $ | 299 | |||
Diluted EPS, adjusted for special items(1) | $ | 0.98 | $ | 1.03 | |||
Year Ending | |||||||
December 31, 2019 | |||||||
Low Case | High Case | ||||||
Net income attributable to Hilton stockholders, before special items | $ | 881 | $ | 903 | |||
Diluted EPS, before special items(1) | $ | 3.02 | $ | 3.09 | |||
Special items(2): | |||||||
Net other expenses from managed and franchised properties | $ | 12 | $ | 12 | |||
Purchase accounting amortization | 203 | 203 | |||||
FF&E replacement reserves | 62 | 62 | |||||
Other adjustments | 18 | 18 | |||||
Total special items before tax | 295 | 295 | |||||
Income tax expense on special items | (74 | ) | (74 | ) | |||
Total special items after tax | $ | 221 | $ | 221 | |||
Net income, adjusted for special items | $ | 1,102 | $ | 1,124 | |||
Diluted EPS, adjusted for special items(1) | $ | 3.78 | $ | 3.85 | |||
_______________ | |
(1) | Does not include the effect of potential share repurchases. |
(2) | See "—Net Income and Diluted EPS, Adjusted for Special Items" for details of these special items. |
HILTON WORLDWIDE HOLDINGS INC. | |||||
NON-GAAP FINANCIAL MEASURES RECONCILIATIONS | |||||
OUTLOOK: ADJUSTED EBITDA | |||||
FORECASTED 2019 | |||||
(unaudited, in millions) | |||||
Three Months Ending | |||||
September 30, 2019 | |||||
Low Case | High Case | ||||
Net income | $ | 239 | $ | 253 | |
Interest expense | 106 | 106 | |||
Income tax expense | 95 | 101 | |||
Depreciation and amortization | 85 | 85 | |||
EBITDA | 525 | 545 | |||
FF&E replacement reserves | 16 | 16 | |||
Share-based compensation expense | 39 | 39 | |||
Amortization of contract acquisition costs | 7 | 7 | |||
Other adjustment items(1) | 3 | 3 | |||
Adjusted EBITDA | $ | 590 | $ | 610 | |
Year Ending | |||||
December 31, 2019 | |||||
Low Case | High Case | ||||
Net income | $ | 887 | $ | 909 | |
Interest expense | 418 | 418 | |||
Income tax expense | 344 | 352 | |||
Depreciation and amortization | 341 | 341 | |||
EBITDA | 1,990 | 2,020 | |||
Loss on foreign currency transactions | 3 | 3 | |||
FF&E replacement reserves | 62 | 62 | |||
Share-based compensation expense | 149 | 149 | |||
Amortization of contract acquisition costs | 29 | 29 | |||
Net other expenses from managed and franchised properties | 12 | 12 | |||
Other adjustment items(1) | 35 | 35 | |||
Adjusted EBITDA | $ | 2,280 | $ | 2,310 | |
_______________ | |
(1) | Includes adjustments for expenses recognized in connection with the refinancings and repayments of the senior secured credit facilities, severance and other items. |
HILTON WORLDWIDE HOLDINGS INC.
DEFINITIONS
Trailing Twelve Month Financial Information
This press release includes certain unaudited financial information for the TTM period ended June 30, 2019, which is calculated as the six months ended June 30, 2019 plus the year ended December 31, 2018 less the six months ended June 30, 2018. This presentation is not in accordance with GAAP. However, the Company believes that this presentation provides useful information to investors regarding its recent financial performance, and it views this presentation of the four most recently completed fiscal quarters as a key measurement period for investors to assess its historical results. In addition, the Company’s management uses TTM information to evaluate the Company’s financial performance for ongoing planning purposes.
Net Income and Diluted EPS, Adjusted for Special Items
Net income (loss), adjusted for special items, and diluted earnings (loss) per share ("EPS"), adjusted for special items, are not recognized terms under GAAP and should not be considered as alternatives to net income (loss) or other measures of financial performance or liquidity derived in accordance with GAAP. In addition, the Company's definition of net income (loss), adjusted for special items, and diluted EPS, adjusted for special items, may not be comparable to similarly titled measures of other companies.
Net income (loss), adjusted for special items, and diluted EPS, adjusted for special items, are included to assist investors in performing meaningful comparisons of past, present and future operating results and as a means of highlighting the results of the Company's ongoing operations.
Beginning with the first quarter of 2019, the Company modified the definition of net income (loss), adjusted for special items, and diluted EPS, adjusted for special items, as previously calculated, to exclude: (i) FF&E replacement reserves required under certain lease agreements and (ii) the amortization of intangible assets that were recorded at their fair value at the time of the Merger.
EBITDA, Adjusted EBITDA and Adjusted EBITDA Margin
Earnings before interest expense, taxes and depreciation and amortization ("EBITDA"), presented herein, reflects net income (loss), excluding interest expense, a provision for income taxes and depreciation and amortization.
Adjusted EBITDA, presented herein, is calculated as EBITDA, as previously defined, further adjusted to exclude certain items, including gains, losses, revenues and expenses in connection with: (i) asset dispositions for both consolidated and unconsolidated equity investments; (ii) foreign currency transactions; (iii) debt restructurings and retirements; (iv) FF&E replacement reserves; (v) reorganization costs; (vi) share-based compensation expense; (vii) non-cash impairment losses; (viii) severance, relocation and other expenses; (ix) amortization of contract acquisition costs; (x) the net effect of reimbursable costs included in other revenues and expenses from managed and franchised properties; and (xi) other items.
Adjusted EBITDA margin represents Adjusted EBITDA as a percentage of total revenues, as adjusted to exclude the amortization of contract acquisition costs and other revenues from managed and franchised properties.
The Company believes that EBITDA, Adjusted EBITDA and Adjusted EBITDA margin provide useful information to investors about the Company and its financial condition and results of operations for the following reasons: (i) these measures are among the measures used by the Company's management team to evaluate its operating performance and make day-to-day operating decisions and (ii) these measures are frequently used by securities analysts, investors and other interested parties as a common performance measure to compare results or estimate valuations across companies in the industry. Additionally, these measures exclude certain items that can vary widely across different industries and among competitors within the Company's industry. For instance, interest expense and the provision for income taxes are dependent on company specifics, including, among other things, capital structure and operating jurisdictions, respectively, and, therefore could vary significantly across companies. Depreciation and amortization, as well as amortization of contract acquisition costs, are dependent upon company policies, including the method of acquiring and depreciating assets and the useful lives that are used. For Adjusted EBITDA, the Company also excludes items such as: (i) FF&E replacement reserves to be consistent with the treatment of FF&E for its owned and leased hotels where it is capitalized and depreciated over the life of the FF&E; (ii) share-based compensation expense, as this could vary widely among companies due to the different plans in place and the usage of them; (iii) the net effect of the Company's cost reimbursement revenues and reimbursed expenses, as the Company contractually does not operate the related programs to generate a profit over the terms of the respective contracts; and (iv) other items that are not core to the Company's operations and are not reflective of the Company's performance. The Company does not include a future estimate of the net effect of cost reimbursement revenues and reimbursed expenses within the Company's outlook.
EBITDA, Adjusted EBITDA and Adjusted EBITDA margin are not recognized terms under GAAP and should not be considered as alternatives, in isolation or as a substitute, to net income (loss) or other measures of financial performance or liquidity derived in accordance with GAAP. The Company's definitions of EBITDA, Adjusted EBITDA and Adjusted EBITDA margin may not be comparable to similarly titled measures of other companies and may have limitations as analytical tools.
Net Debt
Net debt, presented herein, is a non-GAAP financial measure that the Company uses to evaluate its financial leverage. Net debt is calculated as: (i) long-term debt, including current maturities and excluding unamortized deferred financing costs and discount and (ii) the Company's share of unconsolidated affiliate debt, excluding unamortized deferred financing costs; reduced by: (a) cash and cash equivalents and (b) restricted cash and cash equivalents. Net debt should not be considered as a substitute to debt presented in accordance with GAAP. Net debt may not be comparable to a similarly titled measure of other companies.
The Company believes net debt provides useful information about its indebtedness to investors as it is frequently used by securities analysts, investors and other interested parties to compare the indebtedness of companies.
Net Debt to Adjusted EBITDA Ratio
Net debt to Adjusted EBITDA ratio, presented herein, is a non-GAAP financial measure and is included as it is frequently used by securities analysts, investors and other interested parties to compare the financial condition of companies. Net debt to Adjusted EBITDA ratio should not be considered as an alternative to measures of financial condition derived in accordance with GAAP, and it may not be comparable to a similarly titled measure of other companies.
Comparable Hotels
The Company defines comparable hotels as those that: (i) were active and operating in the Company's system for at least one full calendar year as of the end of the current period, and open January 1st of the previous year; (ii) have not undergone a change in brand or ownership type during the current or comparable periods reported; and (iii) have not sustained substantial property damage, business interruption, undergone large-scale capital projects or for which comparable results are not available.
Of the 5,817 hotels in the Company's system as of June 30, 2019, 4,692 hotels were classified as comparable hotels. The 1,125 non-comparable hotels included 234 hotels, or approximately four percent of the total hotels in the system, that were removed from the comparable group during the year because they sustained substantial property damage, business interruption, underwent large-scale capital projects or comparable results were not available.
Occupancy
Occupancy represents the total number of room nights sold divided by the total number of room nights available at a hotel or group of hotels for a given period. Occupancy measures the utilization of the hotels' available capacity. Management uses occupancy to gauge demand at a specific hotel or group of hotels in a given period. Occupancy levels also help management determine achievable average daily rate pricing levels as demand for hotel rooms increases or decreases.
Average Daily Rate ("ADR")
ADR represents hotel room revenue divided by the total number of room nights sold for a given period. ADR measures average room price attained by a hotel, and ADR trends provide useful information concerning the pricing environment and the nature of the customer base of a hotel or group of hotels. ADR is a commonly used performance measure in the industry, and management uses ADR to assess pricing levels that the Company is able to generate by type of customer, as changes in rates charged to customers have a different effect on overall revenues and incremental profitability than changes in occupancy, as described above.
Revenue per Available Room ("RevPAR")
RevPAR is calculated by dividing hotel room revenue by the total number of room nights available to guests for a given period. Management considers RevPAR to be a meaningful indicator of the Company's performance as it provides a metric correlated to two primary and key drivers of operations at a hotel or group of hotels, as previously described: occupancy and ADR. RevPAR is also a useful indicator in measuring performance over comparable periods for comparable hotels.
References to RevPAR, ADR and occupancy throughout this press release are presented on a comparable basis, and references to RevPAR and ADR are presented on a currency neutral basis, unless otherwise noted. As such, comparisons of these hotel operating statistics for the three and six months ended June 30, 2019 and 2018 use the exchange rates for the three and six months ended June 30, 2019, respectively.
View source version on businesswire.com: https://www.businesswire.com/news/home/20190724005172/en/
Contacts:
Jill Slattery
+1 703 883 6043

Stock quotes supplied by Barchart
Quotes delayed at least 20 minutes.
By accessing this page, you agree to the following
Privacy Policy and Terms and Conditions.