


Financial News
The Sahm Rule, Markets, and Recession
 Photo from Unsplash
Originally Posted On: https://delphiadvisers.com/the-sahm-rule-markets-and-recession/
The Sahm Rule, Markets, and Recession
As this article is being written, there is a significant amount of downside volatility occurring within equity markets. The S&P 500 peaked on July 16th and, since that high, as of today (8/5/2024) we have seen it sell off 7.9%. The NASDAQ is officially in correction territory (down ~13.1% since it peaked on 7/11/24). One can never know for sure why markets become volatile in the short term, but the general consensus seems to be the recent unemployment numbers, and a data point referred to as the “Sahm Rule”.
With all the current market volatility, it begs the question: are we already in, or going into, a recession?
The short answer is that, while possible, the data does not actually support that conclusion, at least for now. We are going to dive into why the data does not support the bear market/recession narrative, but first we need to provide some background information on the recent unemployment data as well as the Sahm Rule.
What is the Sahm Rule?
The Sahm Rule was created by Claudia Sahm, an economist who worked at the Federal Reserve and the White House Council of Economic Advisors. The rule serves as an indicator that was designed to analyze the current unemployment rate relative to the unemployment rate over the last 12 months. Put simply, it is supposed to tell us how fast the unemployment rate is increasing compared to the previous 12 months. The actual calculation of the Sahm Rule is the average unemployment rate during the last three months divided by the lowest three-month average unemployment rate during the last 12 months. The higher the result of the calculation, the faster unemployment is changing. The key threshold for the Sahm Rule, albeit arbitrary, is 0.5%. When the result of the calculation is 0.5% or higher, it is supposed to tell us that the unemployment rate is accelerating, which is supposed to indicate that we are already in a recession.i
As we look back at the Sahm Rule and its history of predicting recessions, it has been pretty accurate, resulting in very few false positives. See Figure 1 below.
Figure 1:
 Sahm Recession Indicator signals the start of a recession when the three-month moving average of the national unemployment rate (U3) rises by 0.50 percentage points or more relative to the minimum of the three-month averages from the previous 12 months. Gray highlighted areas are recessions. Data and description provided by The Federal Reserve Bank of St. Louis https://fred.stlouisfed.org/graph/?g=1rbiM
Sahm Rule Deficiencies
Although the Sahm Rule has been quite accurate in the past, it is important to note that this rule does have a number of problems. For instance:
- It was created in 2019 using past data that has been revised after the fact.
- It uses labor market data, which is a lagging indicator.
- It is not designed to deal with shifts in the labor supply, specifically an expanding labor force.
Let’s take a closer look at these key deficiencies.
1.) The Sahm Rule was created in 2019 by looking at past data that has been revised after the fact.
The rule was created by Claudia Sahm, in 2019, as part of a broader policy proposal.ii The timing of the introduction is important because the data used for analysis, particularly recession data, has been revised over the years and may have looked very different when it was initially released. For instance, unemployment data can be revised for a period of five years after being released.iii This means that the data we are seeing released today could very well be revised in the near future, which would change the results of the Sahm Rule.
Because the data is subject to revision, it could very easily lead to a media-induced false panic. And let’s be honest, the media loves a good scare. Even though the media has jumped all over this data point, we won’t know if the Sahm Rule has actually been triggered for many months or even years because it is subject to revisions. Only in hindsight will we have any concrete analysis, which is not at all helpful to investors.
2.) Labor market data is a lagging indicator.
There are three primary types of economic indicators: leading, lagging, and coincident. Put simply, leading indicators help tell us where we are going, lagging indicators tell us where we have been, and coincident indicators tell us where we are.iv
This is important because unemployment data, which is the data that the Sahm Rule uses, is a lagging indicator. That means unemployment data and the Sahm Rule have ZERO predictive power for economics, markets, or even future unemployment or labor force participation rates.
Let’s break this down rationally. Unemployment data measures the number of people who are out of work, but want to be working. For the most part, these folks have been laid off or fired from their jobs and are looking for a new one. When we think about where mass layoffs take place in an economic cycle, they typically occur when we are already in a recession. Businesses do not want to lay off employees if they can avoid it. After all, human capital is one of the most valuable resources to any business, and employees are also expensive to train and onboard. Businesses spend tens of thousands of dollars training employees before those employees ever actually add value to the bottom line. So, they will typically take other measures to try to cut costs first. Companies will only resort to layoffs as a last resort because they are costing themselves future dollars by doing so. This does not mean that there are not bad actors or stupid companies out there that will take a different approach, but, on a scale large enough to affect the economy, those bad actors are insignificant blips on the radar.
3.) The Sahm Rule is not designed to deal with shifts in the labor supply, specifically an expanding labor force.
Of all the deficiencies of the Sahm Rule, this one is the most problematic and relevant to today’s economic landscape.
An upward tick in the unemployment rate is only truly meaningful if the labor force is static or decreasing. The unemployment rate is measured by dividing the number of people out of work by the size of the labor force. When the labor force increases, the unemployment rate can rise and breach the threshold of the Sahm Rule while the economy as a whole continues to add jobs and total economic output. What the Sahm Rule attempts to measure is how quickly the numerator of the equation (number of people out of work but looking) is increasing, but when the labor force grows, those entering the workforce are added to both the numerator and the denominator, skewing the unemployment rate and the relative comparison needed for the Sahm Rule.
There are three primary ways in which the labor force can increase: immigration, young people entering the workforce for the first time, and discouraged workers returning to the labor force as the economy recovers. Traditionally, new workers and immigration are the factors primarily affecting the size of the labor force, but thanks to COVID-era policies, we also have a lot of people making their way back into the labor force for the first time since 2020.
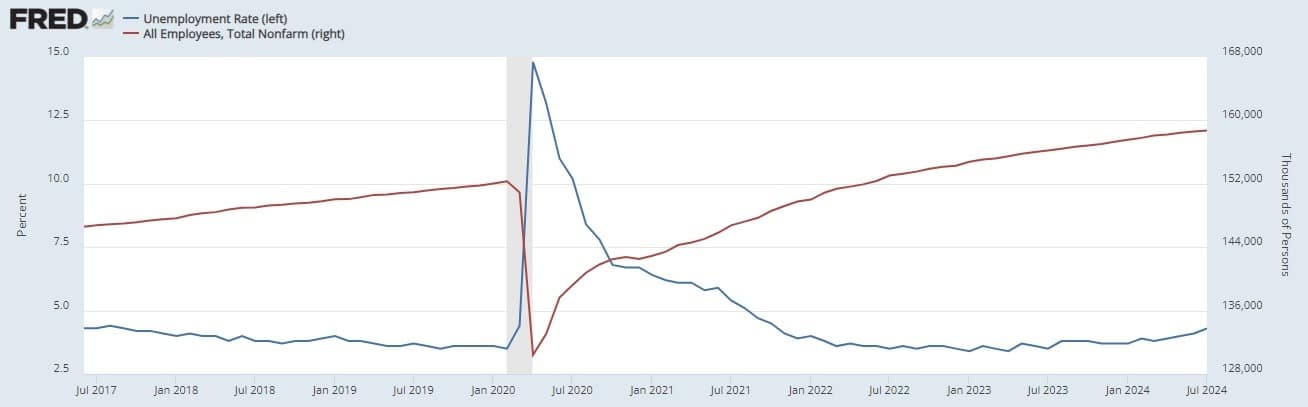
The massive supply of labor returning to the market causes the unemployment rate to rise even though the economy is still adding jobs. This is what our economy is currently facing. The total number of non-farm-employed individuals continues to reach all-time highs as the unemployment rate rises. See Figure 2 below.
Figure 2:
 The unemployment rate represents the number of unemployed as a percentage of the labor force. Labor force data are restricted to people 16 years of age and older, who currently reside in 1 of the 50 states or the District of Columbia, who do not reside in institutions (e.g., penal and mental facilities, homes for the aged), and who are not on active duty in the Armed Forces. Shaded areas indicate U.S. recessions. Graph and data provided by The Federal Reserve Bank of St. Louis https://fred.stlouisfed.org/graph/?g=1rrWa
Because of these massive shifts in the labor supply, even the creator of the Sahm Rule has publicly stated that she does not think the rule is relevant in the current economic climate.v
The Sahm Rule and Markets
Now that we have all the definitions and backstory out of the way, let’s take a look at how the Sahm Rule and unemployment rates have influenced equity markets by analyzing the last four bear markets and recessions.
2020 COVID Bear Market and Recession
The 2020 recession came on fast and furious, as no one saw this virus coming nor did anyone predict how governments would react to it. Ultimately, the pandemic resulted in an incredibly sharp stock market decline followed by a very deep, albeit short, recession. See Figure 3 below.
Figure 3:
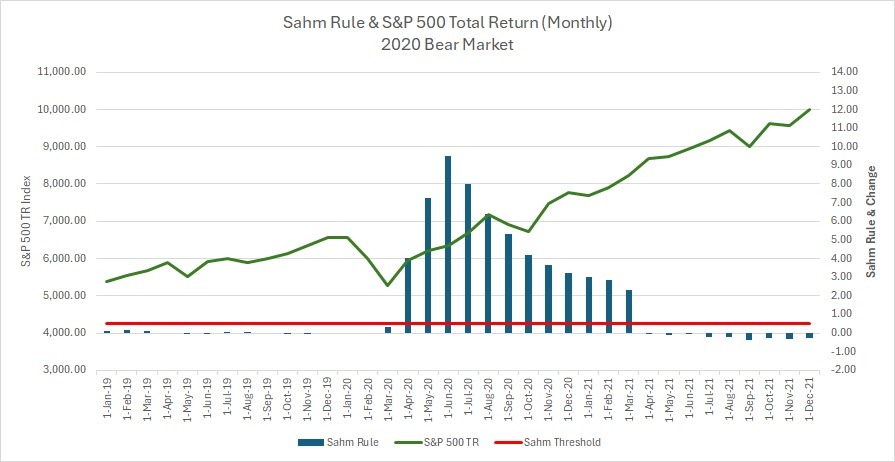 When the blue bar graph representing the Sahm Rule calculation rises above the red line representing the Sahm Rule threshold it signifies the “Recession Indicator” has triggered. S&P 500 Data provided by Yahoo Finance, Sahm Rule data provided by the Federal Reserve Bank of St. Louis.
As you can see in Figure 3 above, the S&P 500 took a sharp dive before the Sahm Rule was triggered. In fact, equity markets were already beginning to recover their losses by the time the Sahm Rule was triggered. Even with such a massive shock to the economic system, the Sahm Rule still lagged behind equity markets. This is because equity markets are a leading economic indicator, while the Sahm Rule is a lagging indicator.
If I were you, I think I would prepare myself to see a theme in the next three bear market analyses.
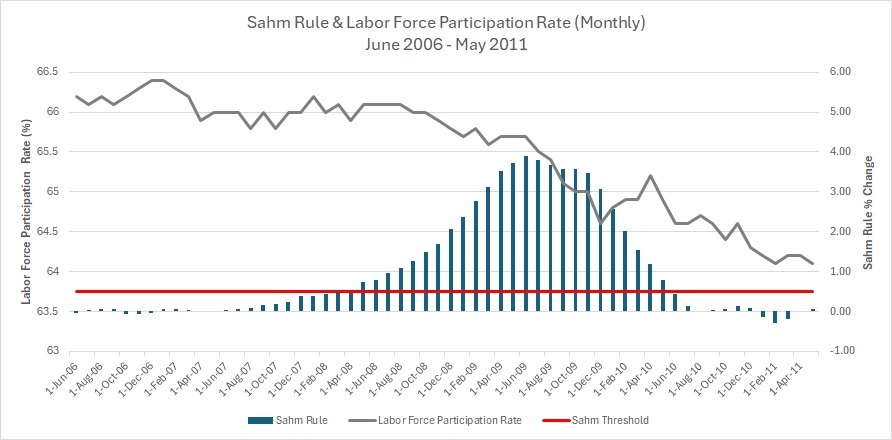
The Great Financial Crisis (GFC) of 2008
The GFC is an event that most investors are intimately familiar with, as it was one of the deepest recessions and bear markets since the Great Depression. The S&P 500 peaked in October of 2007 and then began to fall over 50% until it bottomed out in March of 2009. The Sahm Rule, however, did not breach its 0.5% threshold until we were already well into the recession in April of 2008. Unlike the COVID bear market, the S&P 500 continued to fall for about 10 more months after the Sahm Rule was triggered. See Figure 4 below.
Figure 4:
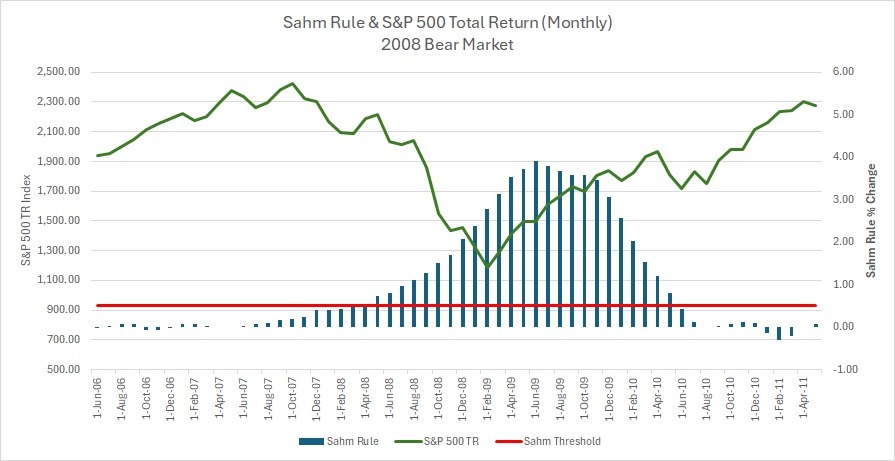 When the blue bar graph representing the Sahm Rule calculation rises above the red line representing the Sahm Rule threshold it signifies the “Recession Indicator” has triggered. S&P 500 Data provided by Yahoo Finance, Sahm Rule data provided by the Federal Reserve Bank of St. Louis.
Just like in 2020, the Sahm Rule did not tell us anything about what was to come, only that we were already in recession. The S&P 500 was already down significantly and telling us that there may be a recession long before unemployment data even surfaced.
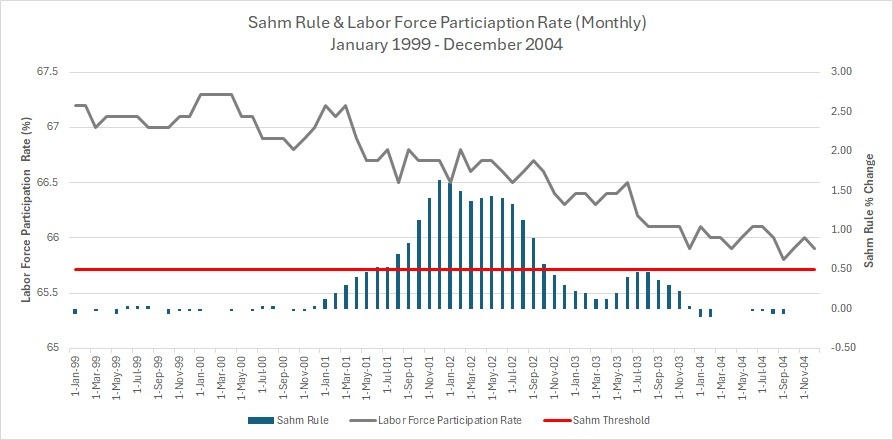
The Tech Bubble of 2000
The bear market and recession of 2000 was created by a massive runup in technology stocks in the late 90’s, ultimately resulting in that bubble bursting and a long, arduous bear market and recession. The 2000 tech bubble bursting was not anywhere as deep of a recession or a bear market as 2008, but it dragged on for far longer. The market peaked in August of 2000 and then fell for over two years, finally bottoming out in September of 2003. The Sahm Rule was triggered in June of 2001 approximately 10 months after the bear market started. See Figure 5 below.
Figure 5:
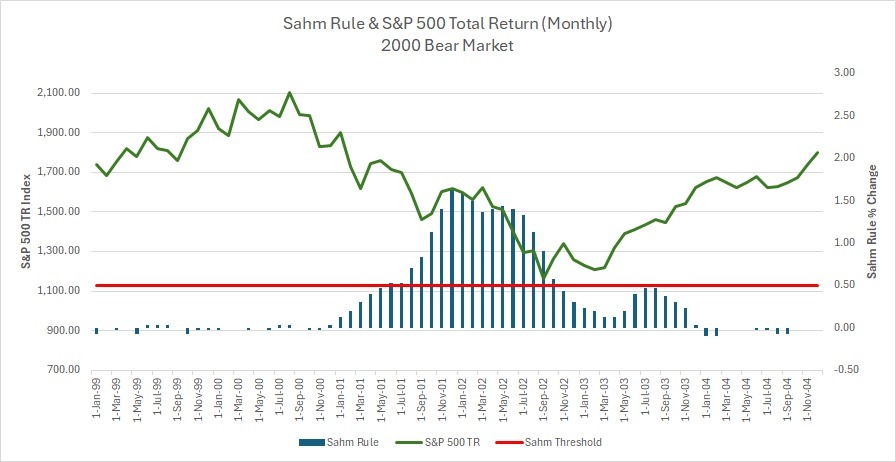 When the blue bar graph representing the Sahm Rule calculation rises above the red line representing the Sahm Rule threshold it signifies the “Recession Indicator” has triggered. S&P 500 Data provided by Yahoo Finance, Sahm Rule data provided by the Federal Reserve Bank of St. Louis.
Again, the Sahm Rule offered no predictive power to forecast the bear market or recession, it just confirmed what was already well known at the time. A recession was not imminent, we were already halfway through it.
The Recession of 1990
Unlike the previous three recessions and bear markets, the recession of 1990 had no major moniker attached to it. This was a slowdown in economic growth that occurred due to the remnants of the savings and loan crises, high oil prices, and restrictive monetary policy, which were all exacerbated by Iraq invading Kuwait. The preceding bull market hit its peak in May of 1990 and then we shifted into a bear market that fell until October of that same year. This was a relatively small bear market but is actually much more characteristic of historical bear markets than the three events outlined previously. The Sahm Rule was triggered in November of 1990 after the market had already begun to recover (See Figure 6 below).
Figure 6:
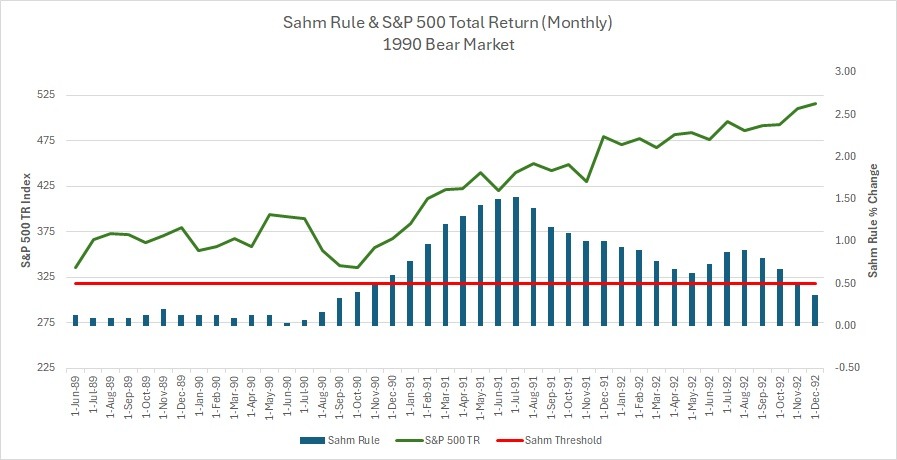 When the blue bar graph representing the Sahm Rule calculation rises above the red line representing the Sahm Rule threshold it signifies the “Recession Indicator” has triggered. S&P 500 Data provided by Yahoo Finance, Sahm Rule data provided by the Federal Reserve Bank of St. Louis.
Again, the Sahm Rule, along with all unemployment data, is lagging. It does not tell us where anything is going, only where things have been. If an investor is using a backwards-looking indicator to time the market, they are likely selling at lows rather than highs, locking in losses and missing out on gains.
That being said, the Sahm rule accurately indicated that a recession had indeed occurred in all four of the above examples. Let’s explore the reasoning behind the accuracy of this indicator in the previous examples.
The Accuracy of the Sahm Rule (1990-2020)
Although each of the aforementioned recessions, and accompanying bear markets, had very different characteristics, causes, and consequences, they all had one thing in common. In every one of these examples, the size of the labor force was static or declining slightly in size. This has nothing to do with the actual cause of the recession, but has everything to do with the accuracy of the Sahm Rule and employment data it uses. As mentioned above, massive shifts in the labor force can have a significant effect on the accuracy of the Sahm Rule. All four of the analyzed periods met the conditions for accuracy. Thus, the Sahm Rule was able to accurately assess the presence of a recession.
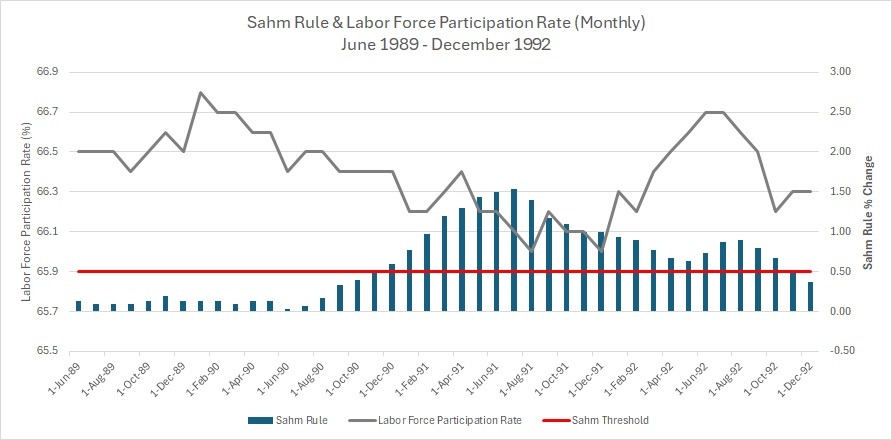
Figures 7-10 below show the labor force participation rate and the Sahm Rule over the exact same time periods that we analyzed prior.
Figure 7:
 When the blue bar graph representing the Sahm Rule calculation rises above the red line representing the Sahm Rule threshold it signifies the “Recession Indicator” has triggered. Sahm Rule and Labor Force Participation Rate data provided by the Federal Reserve Bank of St. Louis.
Figure 8:
 When the blue bar graph representing the Sahm Rule calculation rises above the red line representing the Sahm Rule threshold it signifies the “Recession Indicator” has triggered. Sahm Rule and Labor Force Participation Rate data provided by the Federal Reserve Bank of St. Louis.
Figure 9:
 When the blue bar graph representing the Sahm Rule calculation rises above the red line representing the Sahm Rule threshold it signifies the “Recession Indicator” has triggered. Sahm Rule and Labor Force Participation Rate data provided by the Federal Reserve Bank of St. Louis.
Figure 10:
 When the blue bar graph representing the Sahm Rule calculation rises above the red line representing the Sahm Rule threshold it signifies the “Recession Indicator” has triggered. Sahm Rule and Labor Force Participation Rate data provided by the Federal Reserve Bank of St. Louis.
As you can see in each of the charts above, every time the Sahm Rule has flashed its recession signal, the labor force participation rate had already been on the decline, which indicates a shrinking labor force. This signals that the total number of employed workers in the economy is declining as the unemployment rate rises AND the labor force shrinks. These conditions are perfect for the Sahm Rule to accurately indicate the state of the economy.
So, we know what the past looks like, as we have all the revised data and have verified the conditions that are necessary for this indicator to work properly, but what does the data look like today?
Why 2024 Doesn’t Play by the Rules
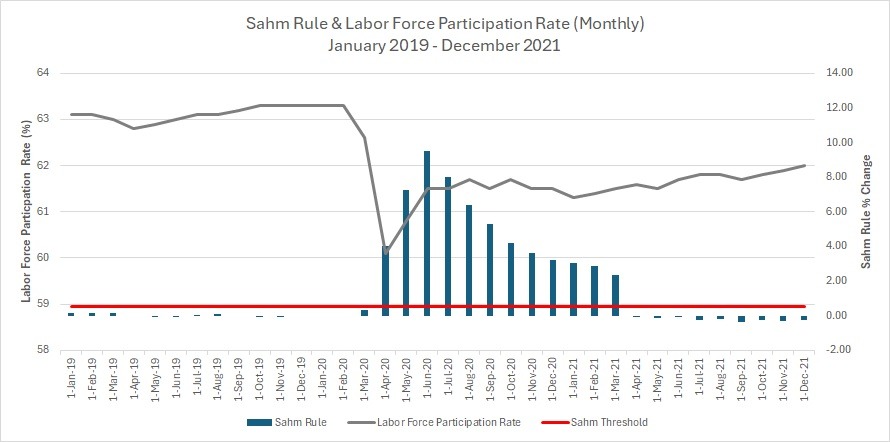
As alluded to earlier, the economic, labor, and market environment today is very different from what we have seen in the prior examples. As you can see in Figure 11 below, the labor force is actually on the rise and not static or in decline.
Figure 11:
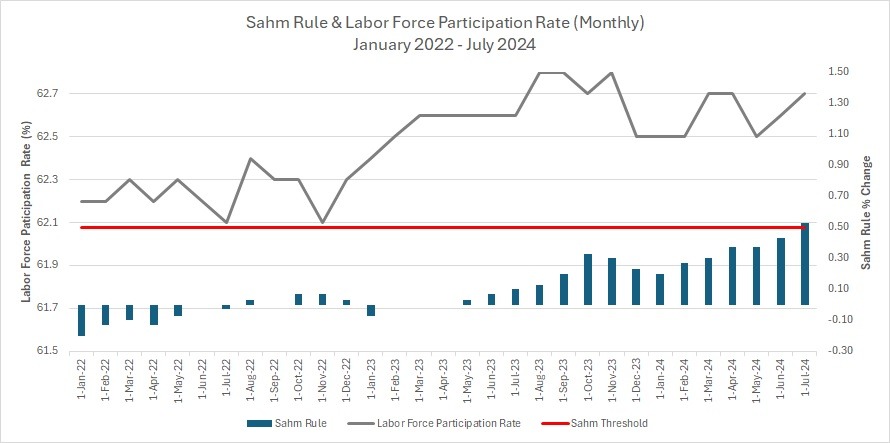 When the blue bar graph representing the Sahm Rule calculation rises above the red line representing the Sahm Rule threshold it signifies the “Recession Indicator” has triggered. Sahm Rule and Labor Force Participation Rate data provided by the Federal Reserve Bank of St. Louis.
As the Sahm Rule hit its 0.5% threshold in July of this year (with unrevised data), the Labor Force Participation Rate continued to tick up and is near post-Covid highs, although still far below pre-COVID levels. This indicates that the increase in the unemployment rate is primarily due to the increase in the size of the labor force rather than jobs disappearing. In fact, in July of 2024, the US economy added 114,000 non-farm employees. Furthermore, we have not seen a contraction of aggregate jobs since December of 2020.vi The total number of employed people in the United States is currently at an all-time high, as depicted in Figure 12 below.
Figure 12:
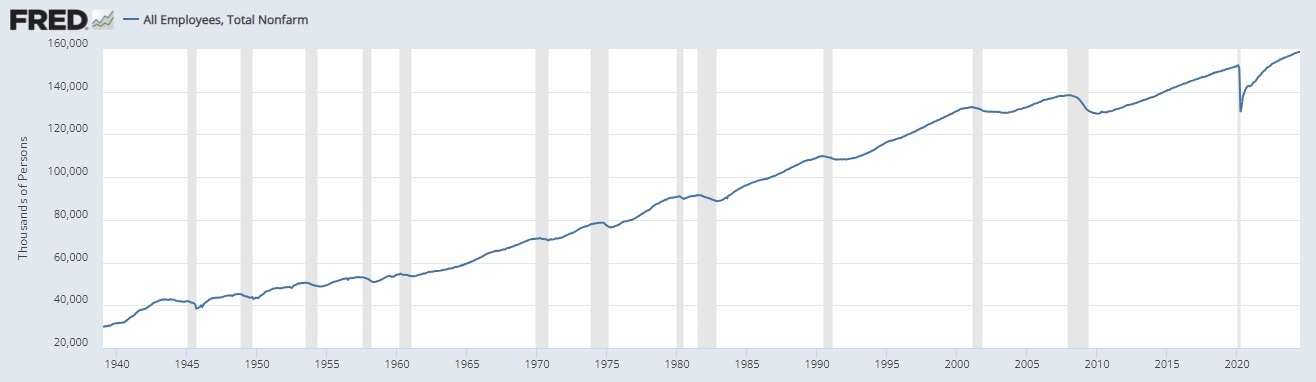 The graph depicts the total number of Nonfarm employees in the united states through July of 2024. Shaded areas indicate U.S. Recession. Graph and data provided by the Federal Reserve Bank of St. Louis: https://fred.stlouisfed.org/graph/?g=1rs8z
Now that we have the employment data sorted out, let’s check the market data against the Sahm Rule and see what it has looked like leading up to the July trigger point of 0.5% (see Figure 13 below).
Figure 13:
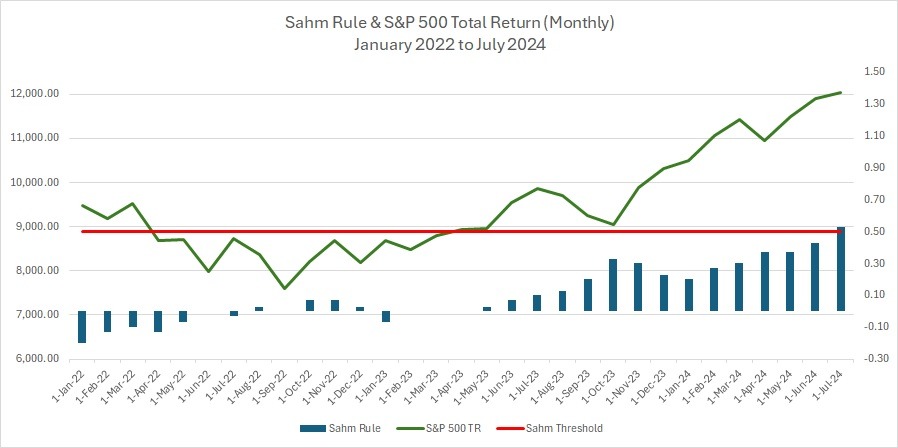 When the blue bar graph representing the Sahm Rule calculation rises above the red line representing the Sahm Rule threshold it signifies the “Recession Indicator” has triggered. S&P 500 Data provided by Yahoo Finance, Sahm Rule data provided by the Federal Reserve Bank of St. Louis.
As you can see above, the S&P 500 has been increasing during the lead up of the Sahm Rule being triggered in July. Typically, stock markets will lead unemployment data, not the other way around.
Based on this data, it seems unlikely that we are currently in a recession. This doesn’t mean that there isn’t one on the horizon (as they are inevitable), but it is unlikely that we are currently in the midst of one.
What This Means for Investors: Correction vs Bear Market
The fact that markets reacted so quickly and negatively to the release of the recent unemployment data tells us that this is likely a fear-based move in the markets rather than a fundamental one. This market environment has all the early characteristics of a short-term correction rather than a prolonged bear market.
A market correction is a sharp decline in stock prices that can happen for any reason or, sometimes, for no reason at all. Corrections happen incredibly fast and are impossible to predict. The good news is that they don’t typically last very long. Markets fall for a couple of months and then are back on an upward trajectory in no time, continuing the bull market cycle for longer. Typically, corrections are a drawdown of between 10% and 20% and last less than a year in total.
By contrast, a bear market is a prolonged downturn that can last anywhere from a year to three years with an average drawdown of about 18 months from peak to trough. Typically, bear markets start pretty slowly, falling a few percentage points per month for three to six months before panic kicks in and a sharp downturn ensues that takes price levels much deeper. A bear market is usually accompanied by a recession (with a couple of exceptions) and is very fundamentals based. Bear markets are caused by one of two things: an overheated economy that reaches euphoric levels or a massive unforeseen event that knocks a few trillion dollars off of global GDP.
An analysis of the current conditions does not signal an overheated euphoric economy. By contrast, there is an abundance of fear circulating. If you ask your neighbor how they are feeling about the economy and markets, they will probably tell you that a recession is on the horizon. Believe it or not, this is good for the markets. Well-circulated data and a little fear lay the groundwork for a continuation of the bull market cycle.
As the famous investor Sir John Templeton said: “Bull markets are born on pessimism, grown on skepticism, mature on optimism, and die on euphoria.” Put differently, bull markets climb a wall of worry. Every brick that gets added to that wall or worry is another traction point for the bull market to climb. It isn’t until there are no more bricks to continue building that wall when one should become fearful.
This does not mean that one should expect massive economic growth or gangbusters stock markets in the near term. The economy has cooled, but we don’t need perfect economic conditions to make solid gains in the stock market. All we need is anything but a recession.
As for the potential of a massive economic event that knocks a few trillion dollars off of global GDP, you can never tell when events like this are on the horizon. The good news is that these types of bear markets and recessions are exceedingly rare. Since 1929, there are only two instances of events like this causing a recession and bear market: World War II and the Great Financial Crisis. As of right now, we don’t see anything like that looming on the horizon, but it is always possible.
As An Investor, What Should I Do?
All the data in the world is lovely, but it doesn’t always answer the question that investors really want to know. What should I do right now?
Our advice? Now is not the time for any major changes or rash decision making. As long as you have a thoughtful, well-built financial plan and investment portfolio, then today is no different from yesterday. When it comes to market corrections, we can never know for sure when they will reverse course or how deep they may go. It could be tomorrow or it could be in six months, after a further drawdown. Since these things are nearly impossible to predict, the right thing to do is to remain disciplined when it comes to your financial strategy and stay invested. Now is the time for a cool head and an iron clad will. Missing out on gains can be even more detrimental to an investor than going through a downturn for those with a reasonably long time horizon.
Have questions or want to know more? Feel free to reach out to us. We are always happy to chat.
[i] https://www.investopedia.com/what-is-the-sahm-rule-8637564
[ii] https://www.cnbc.com/2024/08/05/recession-what-is-the-sahm-rule-and-why-is-everyone-talking-about-it.html#:~:text=The%20time%2Dtested%20indicator%2C%20which,a%20policy%20proposal%20in%202019
[iii] https://dol.ny.gov/labor-force-and-unemployment-data-technical-notes
[iv] https://www.investopedia.com/ask/answers/what-are-leading-lagging-and-coincident-indicators/
[v] https://fortune.com/2024/08/02/recession-indicator-claudia-sahm-rule-trigger-unemployment-rate-jobs-report/
[vi] https://fred.stlouisfed.org/series/PAYEMS#0

Stock quotes supplied by Barchart
Quotes delayed at least 20 minutes.
By accessing this page, you agree to the following
Privacy Policy and Terms and Conditions.