


Financial News
Connection (NASDAQ:CNXN) Misses Q4 CY2025 Revenue Estimates

IT solutions provider Connection (NASDAQ: CNXN) fell short of the market’s revenue expectations in Q4 CY2025, with sales flat year on year at $702.9 million. Its non-GAAP profit of $0.91 per share was 5.8% above analysts’ consensus estimates.
Is now the time to buy Connection? Find out by accessing our full research report, it’s free.
Connection (CNXN) Q4 CY2025 Highlights:
- Revenue: $702.9 million vs analyst estimates of $735.5 million (flat year on year, 4.4% miss)
- Adjusted EPS: $0.91 vs analyst estimates of $0.86 (5.8% beat)
- Adjusted EBITDA: $31.77 million vs analyst estimates of $28.5 million (4.5% margin, 11.5% beat)
- Operating Margin: 3.4%, in line with the same quarter last year
- Free Cash Flow Margin: 3.6%, similar to the same quarter last year
- Market Capitalization: $1.48 billion
Company Overview
Starting as a small computer products seller in 1982 and evolving into a Fortune 1000 company, Connection (NASDAQ: CNXN) is a technology solutions provider that helps businesses and government agencies design, purchase, implement, and manage their IT infrastructure and systems.
Revenue Growth
A company’s long-term sales performance can indicate its overall quality. Any business can put up a good quarter or two, but many enduring ones grow for years.
With $2.87 billion in revenue over the past 12 months, Connection is a mid-sized business services company, which sometimes brings disadvantages compared to larger competitors benefiting from better economies of scale.
As you can see below, Connection grew its sales at a sluggish 2.1% compounded annual growth rate over the last five years. This shows it failed to generate demand in any major way and is a rough starting point for our analysis.
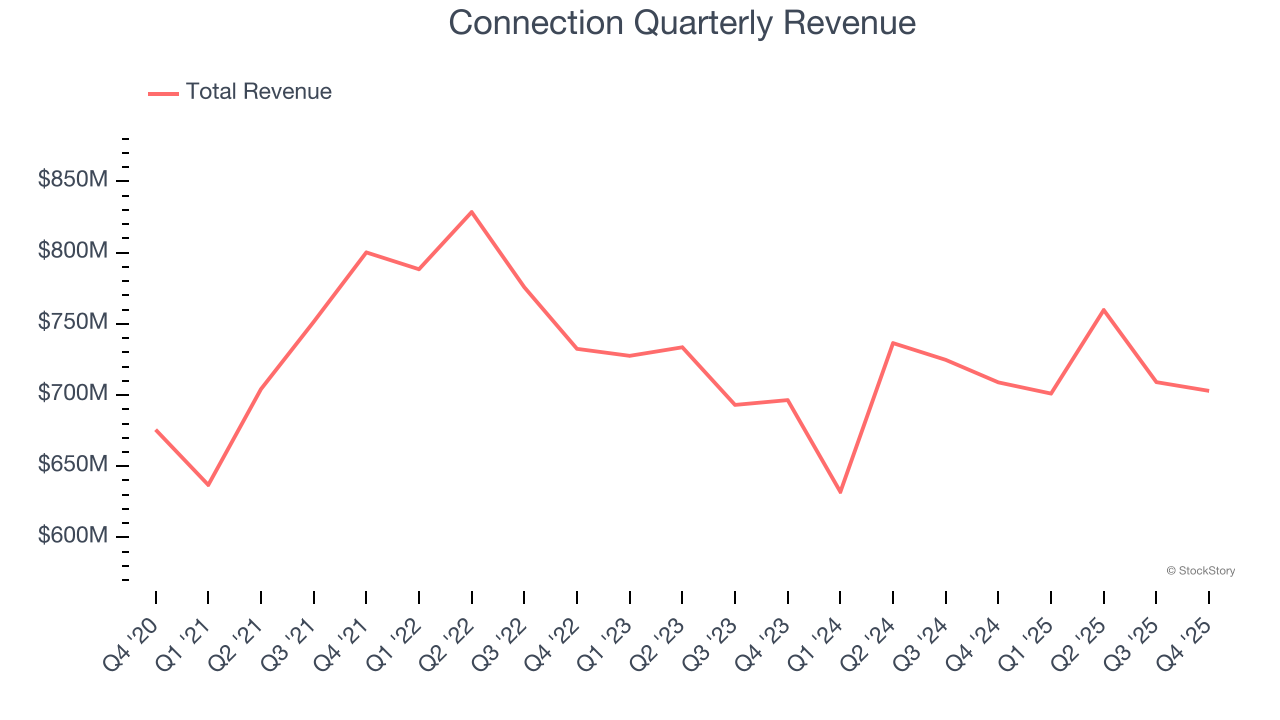
We at StockStory place the most emphasis on long-term growth, but within business services, a half-decade historical view may miss recent innovations or disruptive industry trends. Connection’s recent performance shows its demand has slowed as its revenue was flat over the last two years. 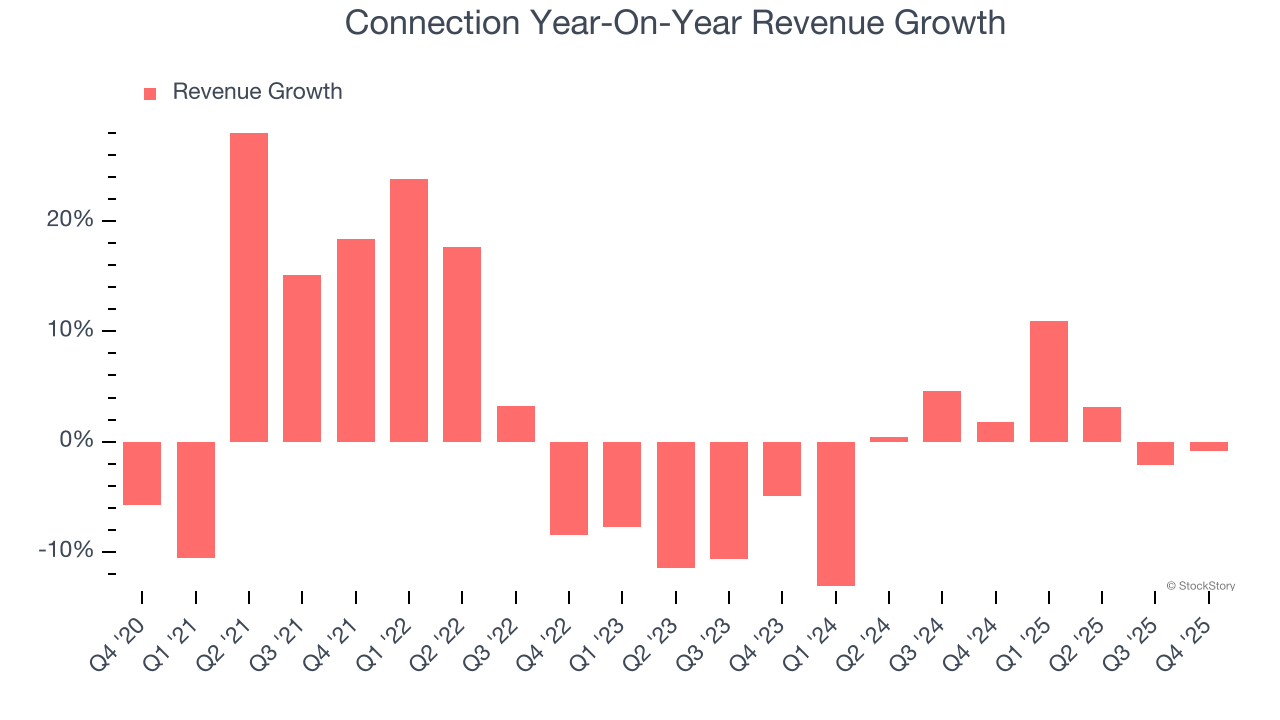
This quarter, Connection missed Wall Street’s estimates and reported a rather uninspiring 0.8% year-on-year revenue decline, generating $702.9 million of revenue.
Looking ahead, sell-side analysts expect revenue to grow 5.7% over the next 12 months, an improvement versus the last two years. This projection is above the sector average and suggests its newer products and services will catalyze better top-line performance.
While Wall Street chases Nvidia at all-time highs, an under-the-radar semiconductor supplier is dominating a critical AI component these giants can’t build without. Click here to access our free report one of our favorites growth stories.
Operating Margin
Connection’s operating margin might fluctuated slightly over the last 12 months but has remained more or less the same, averaging 3.6% over the last five years. This profitability was lousy for a business services business and caused by its suboptimal cost structure.
Analyzing the trend in its profitability, Connection’s operating margin might fluctuated slightly but has generally stayed the same over the last five years. This raises questions about the company’s expense base because its revenue growth should have given it leverage on its fixed costs, resulting in better economies of scale and profitability.
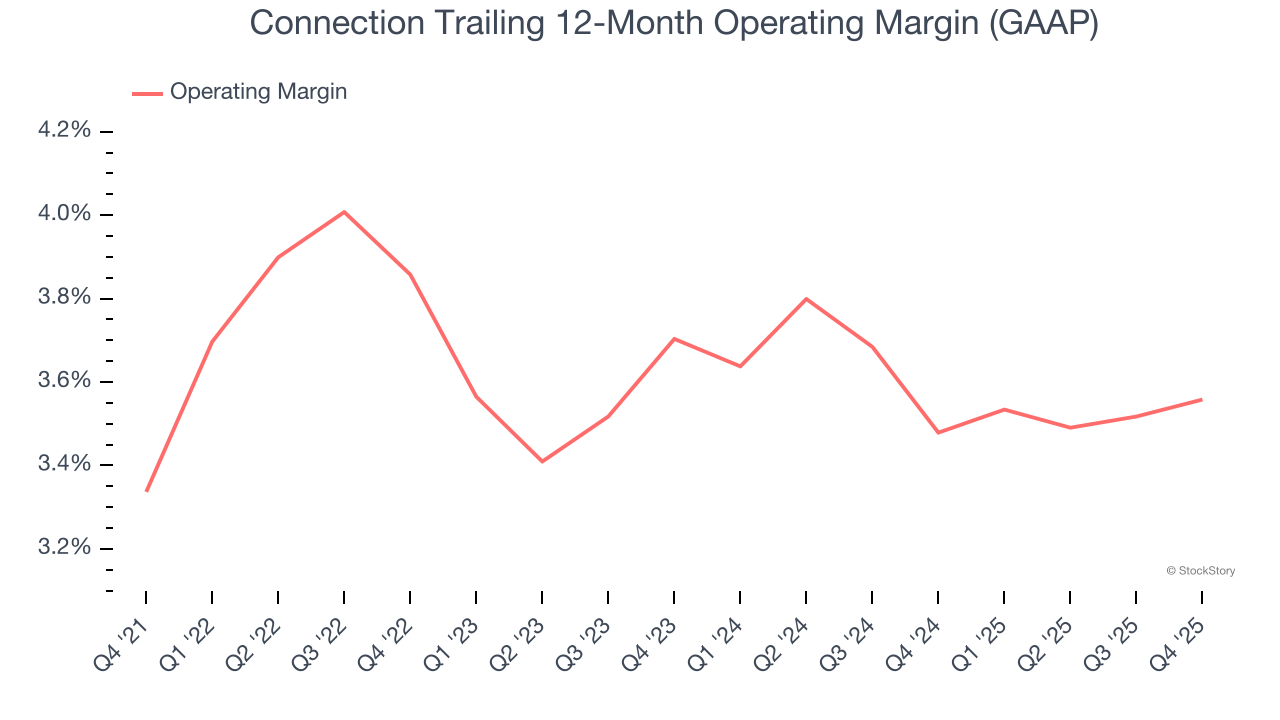
In Q4, Connection generated an operating margin profit margin of 3.4%, in line with the same quarter last year. This indicates the company’s overall cost structure has been relatively stable.
Earnings Per Share
We track the long-term change in earnings per share (EPS) for the same reason as long-term revenue growth. Compared to revenue, however, EPS highlights whether a company’s growth is profitable.
Connection’s EPS grew at a solid 10% compounded annual growth rate over the last five years, higher than its 2.1% annualized revenue growth. However, this alone doesn’t tell us much about its business quality because its operating margin didn’t improve.
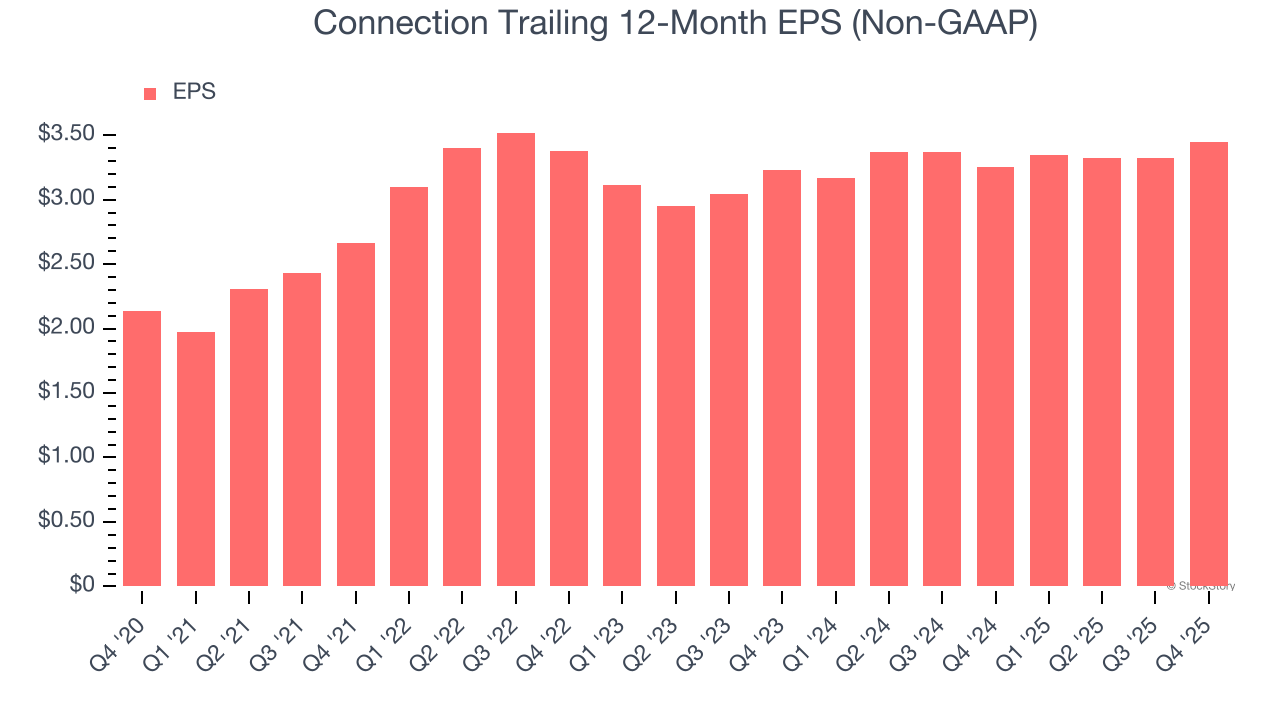
Like with revenue, we analyze EPS over a more recent period because it can provide insight into an emerging theme or development for the business.
For Connection, its two-year annual EPS growth of 3.3% was lower than its five-year trend. We hope its growth can accelerate in the future.
In Q4, Connection reported adjusted EPS of $0.91, up from $0.78 in the same quarter last year. This print beat analysts’ estimates by 5.8%. Over the next 12 months, Wall Street expects Connection’s full-year EPS of $3.45 to grow 10%.
Key Takeaways from Connection’s Q4 Results
It was good to see Connection beat analysts’ EPS expectations this quarter. On the other hand, its revenue missed. Overall, this was a mixed quarter. The stock remained flat at $60.24 immediately following the results.
Should you buy the stock or not? If you’re making that decision, you should consider the bigger picture of valuation, business qualities, as well as the latest earnings. We cover that in our actionable full research report which you can read here (it’s free).
More News
View More


Recent Quotes
View MoreQuotes delayed at least 20 minutes.
By accessing this page, you agree to the Privacy Policy and Terms Of Service.