


Financial News
3 Reasons to Sell SWK and 1 Stock to Buy Instead

Stanley Black & Decker trades at $83.73 and has moved in lockstep with the market. Its shares have returned 13% over the last six months while the S&P 500 has gained 8.1%.
Is now the time to buy Stanley Black & Decker, or should you be careful about including it in your portfolio? Get the full breakdown from our expert analysts, it’s free.
Why Do We Think Stanley Black & Decker Will Underperform?
We don't have much confidence in Stanley Black & Decker. Here are three reasons we avoid SWK and a stock we'd rather own.
1. Core Business Falling Behind as Demand Declines
In addition to reported revenue, organic revenue is a useful data point for analyzing Professional Tools and Equipment companies. This metric gives visibility into Stanley Black & Decker’s core business because it excludes one-time events such as mergers, acquisitions, and divestitures along with foreign currency fluctuations - non-fundamental factors that can manipulate the income statement.
Over the last two years, Stanley Black & Decker’s organic revenue averaged 1.2% year-on-year declines. This performance was underwhelming and implies it may need to improve its products, pricing, or go-to-market strategy. It also suggests Stanley Black & Decker might have to lean into acquisitions to grow, which isn’t ideal because M&A can be expensive and risky (integrations often disrupt focus). 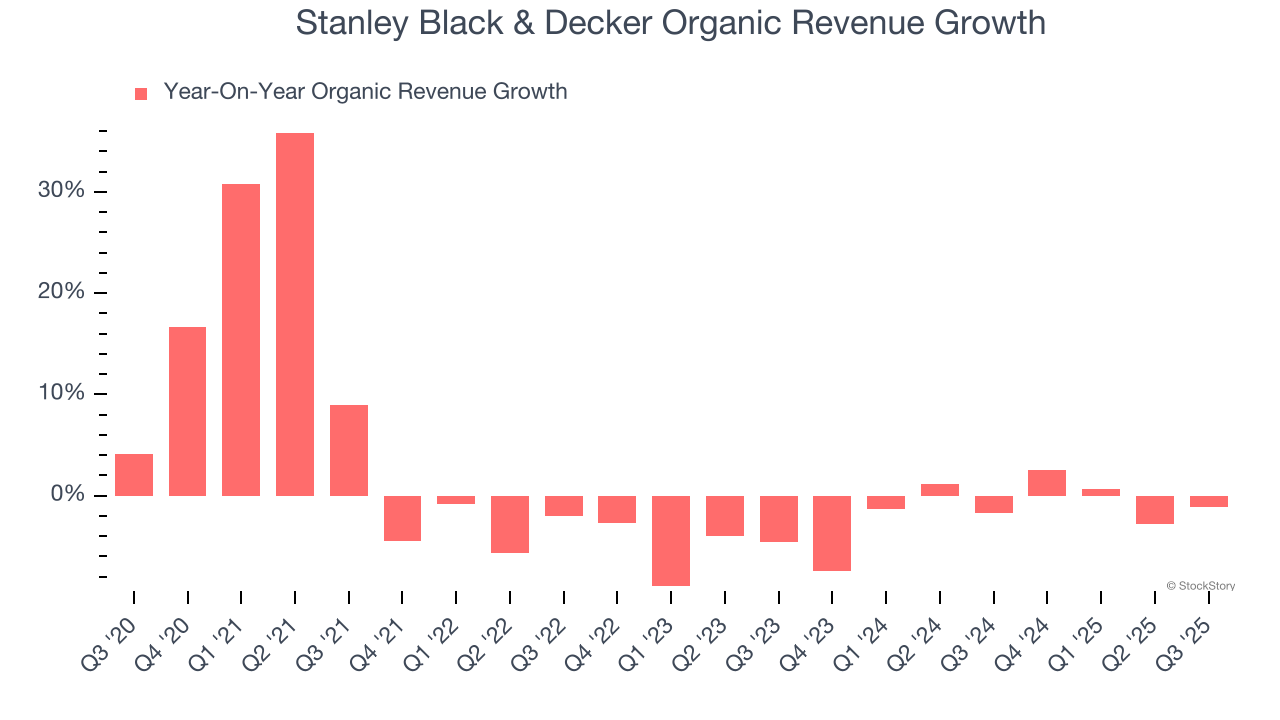
2. EPS Trending Down
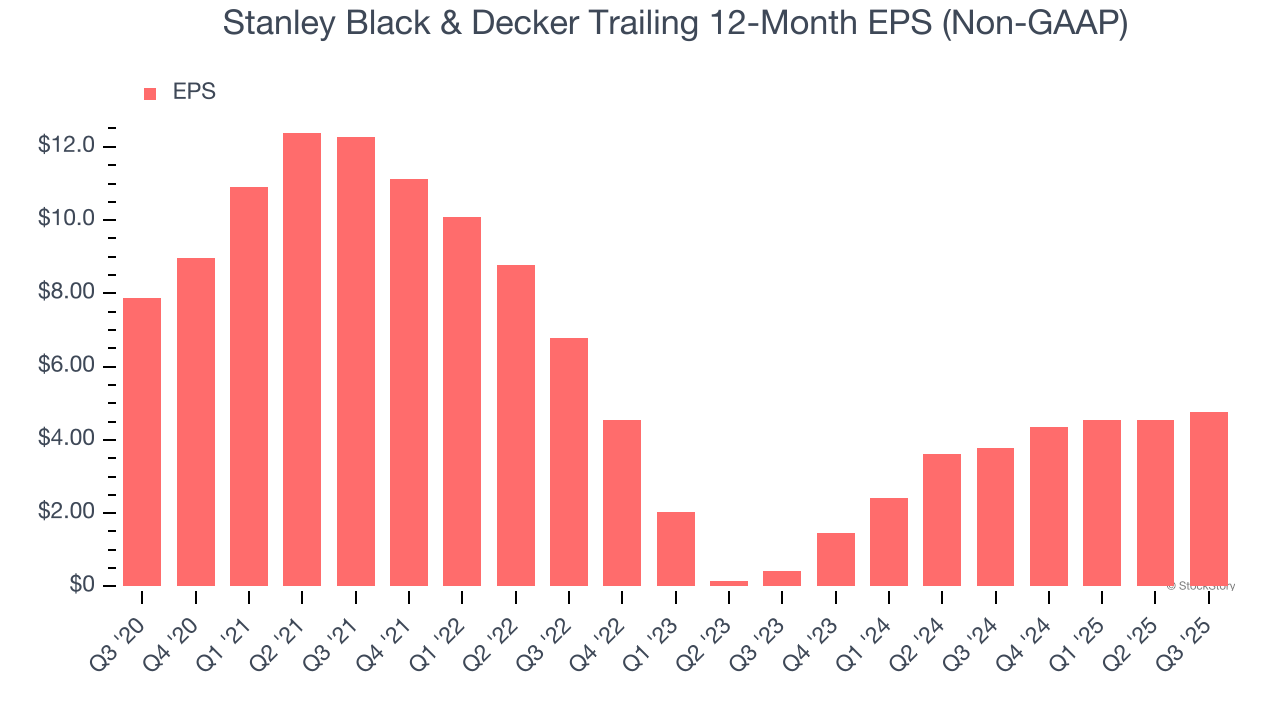
We track the long-term change in earnings per share (EPS) because it highlights whether a company’s growth is profitable.
Sadly for Stanley Black & Decker, its EPS declined by 9.6% annually over the last five years while its revenue grew by 3.5%. This tells us the company became less profitable on a per-share basis as it expanded.
3. Free Cash Flow Margin Dropping
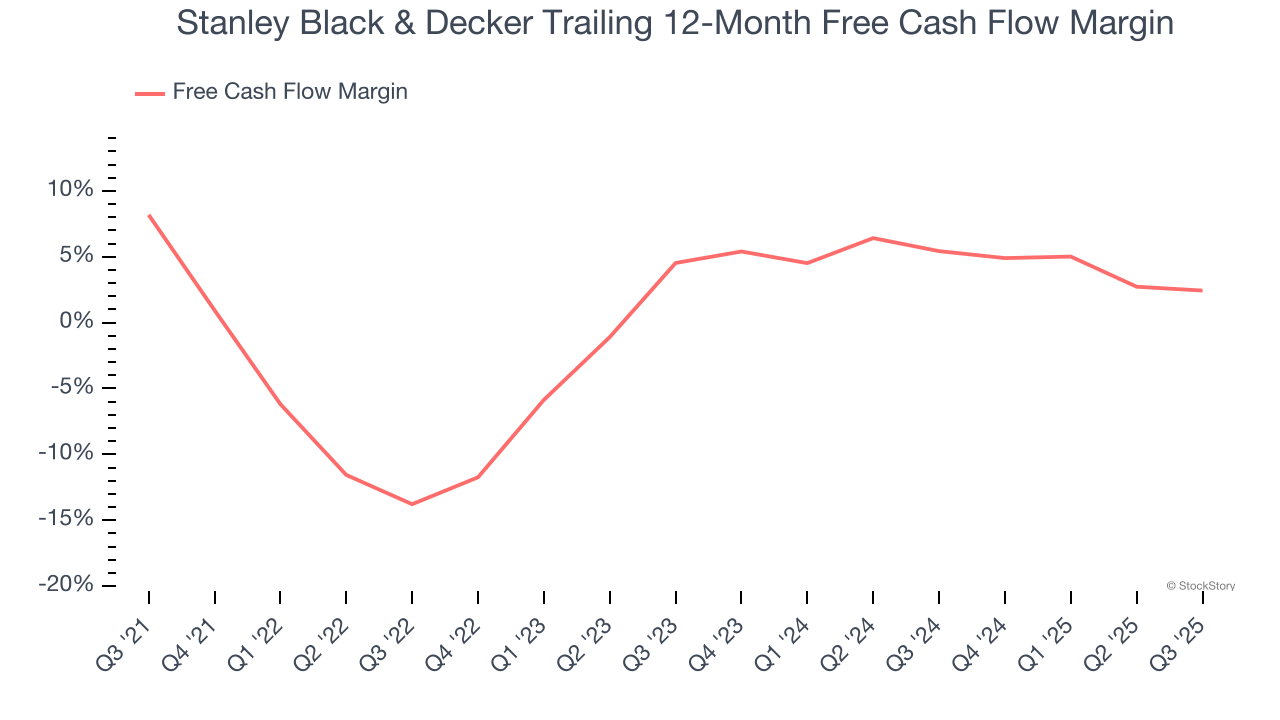
Free cash flow isn't a prominently featured metric in company financials and earnings releases, but we think it's telling because it accounts for all operating and capital expenses, making it tough to manipulate. Cash is king.
As you can see below, Stanley Black & Decker’s margin dropped by 5.7 percentage points over the last five years. Almost any movement in the wrong direction is undesirable because of its already low cash conversion. If the trend continues, it could signal it’s in the middle of a big investment cycle. Stanley Black & Decker’s free cash flow margin for the trailing 12 months was 2.4%.
Final Judgment
We cheer for all companies making their customers lives easier, but in the case of Stanley Black & Decker, we’ll be cheering from the sidelines. That said, the stock currently trades at 16.2× forward P/E (or $83.73 per share). This valuation multiple is fair, but we don’t have much confidence in the company. There are more exciting stocks to buy at the moment. We’d recommend looking at one of our all-time favorite software stocks.
Stocks We Like More Than Stanley Black & Decker
If your portfolio success hinges on just 4 stocks, your wealth is built on fragile ground. You have a small window to secure high-quality assets before the market widens and these prices disappear.
Don’t wait for the next volatility shock. Check out our Top 6 Stocks for this week. This is a curated list of our High Quality stocks that have generated a market-beating return of 244% over the last five years (as of June 30, 2025).
Stocks that have made our list include now familiar names such as Nvidia (+1,326% between June 2020 and June 2025) as well as under-the-radar businesses like the once-small-cap company Comfort Systems (+782% five-year return). Find your next big winner with StockStory today.
More News
View More


Recent Quotes
View MoreQuotes delayed at least 20 minutes.
By accessing this page, you agree to the Privacy Policy and Terms Of Service.