


Financial News
CSG (NASDAQ:CSGS) Reports Q3 In Line With Expectations

Customer experience software company CSG Systems (NASDAQ: CSGS) met Wall Streets revenue expectations in Q3 CY2025, with sales up 2.9% year on year to $303.6 million. Its non-GAAP profit of $1.31 per share was 17.3% above analysts’ consensus estimates.
Is now the time to buy CSG? Find out by accessing our full research report, it’s free for active Edge members.
CSG (CSGS) Q3 CY2025 Highlights:
- Revenue: $303.6 million vs analyst estimates of $304.3 million (2.9% year-on-year growth, in line)
- Adjusted EPS: $1.31 vs analyst estimates of $1.12 (17.3% beat)
- Adjusted EBITDA: $68.98 million vs analyst estimates of $62.33 million (22.7% margin, 10.7% beat)
- Operating Margin: 10%, in line with the same quarter last year
- Free Cash Flow Margin: 14.5%, up from 10.8% in the same quarter last year
- Market Capitalization: $2.04 billion
Company Overview
Powering billions of critical customer interactions annually, CSG Systems (NASDAQ: CSGS) provides cloud-based software platforms that help companies manage customer interactions, process payments, and monetize their services.
Revenue Growth
Examining a company’s long-term performance can provide clues about its quality. Even a bad business can shine for one or two quarters, but a top-tier one grows for years.
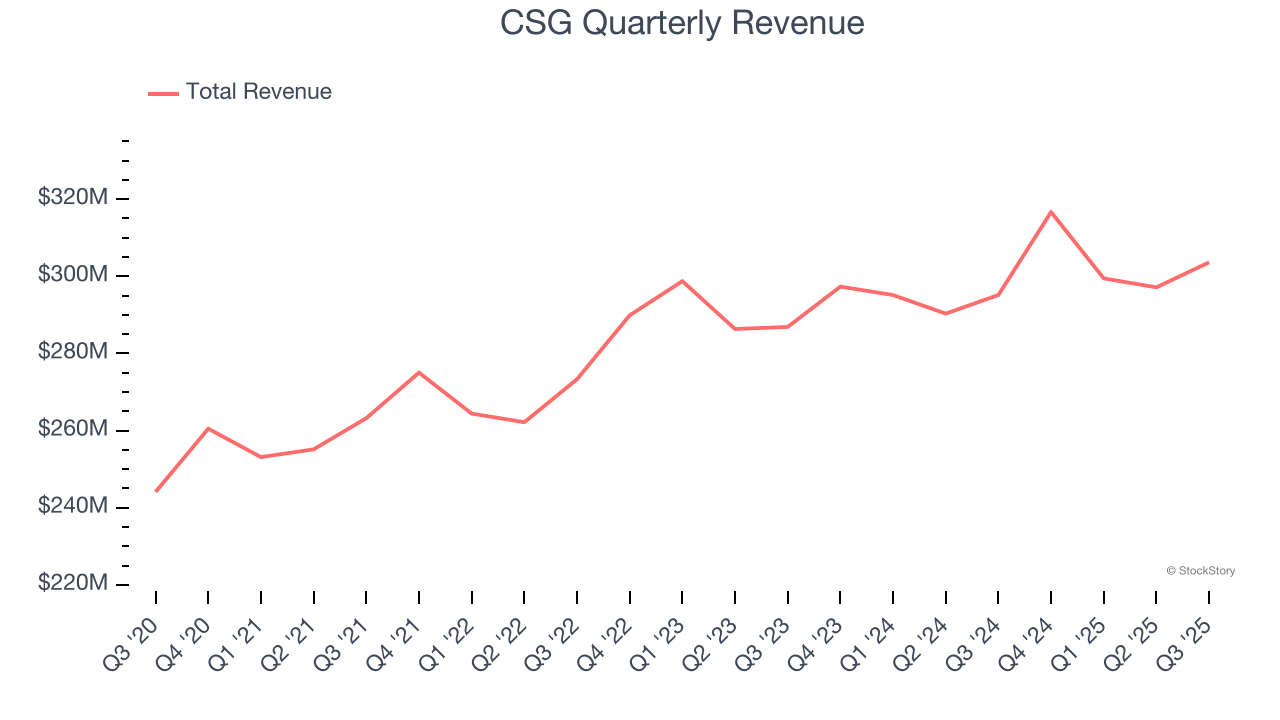
With $1.22 billion in revenue over the past 12 months, CSG is a small player in the business services space, which sometimes brings disadvantages compared to larger competitors benefiting from economies of scale and numerous distribution channels.
As you can see below, CSG grew its sales at a mediocre 4.3% compounded annual growth rate over the last five years. This shows it couldn’t generate demand in any major way and is a tough starting point for our analysis.
We at StockStory place the most emphasis on long-term growth, but within business services, a half-decade historical view may miss recent innovations or disruptive industry trends. CSG’s recent performance shows its demand has slowed as its annualized revenue growth of 2.3% over the last two years was below its five-year trend. 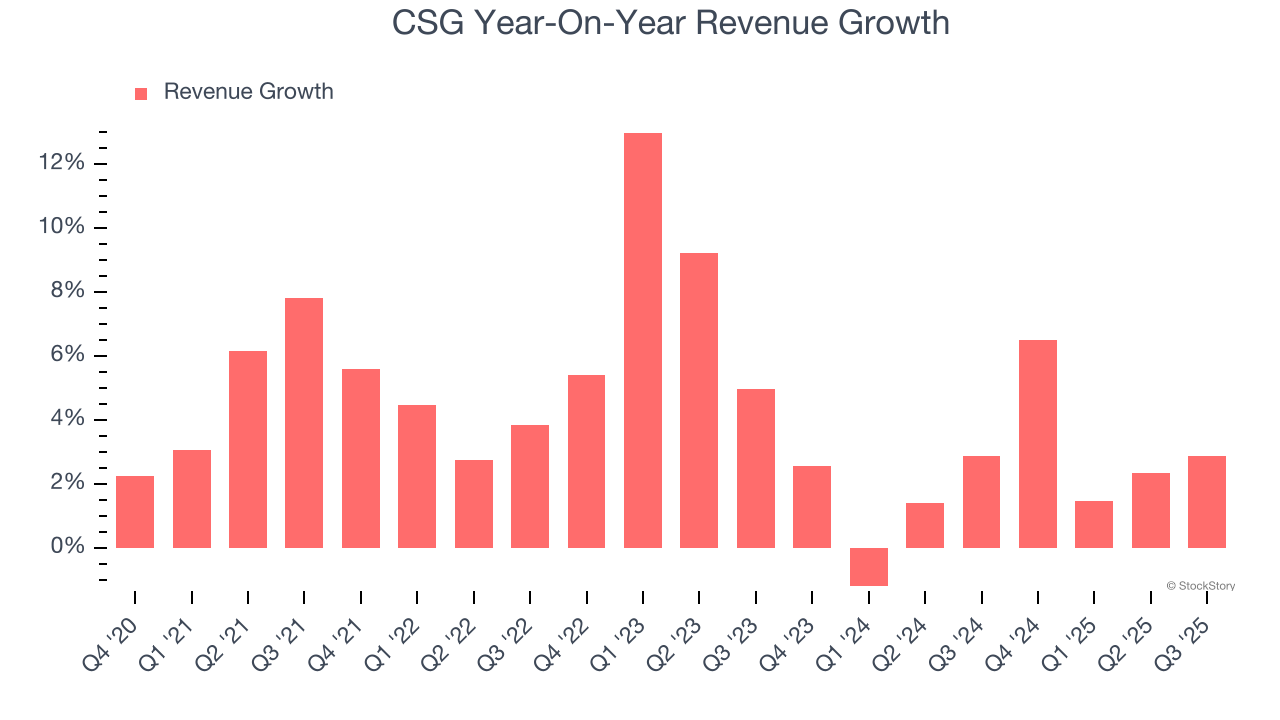
This quarter, CSG grew its revenue by 2.9% year on year, and its $303.6 million of revenue was in line with Wall Street’s estimates.
Looking ahead, sell-side analysts expect revenue to grow 3.2% over the next 12 months, similar to its two-year rate. This projection is underwhelming and implies its newer products and services will not accelerate its top-line performance yet.
While Wall Street chases Nvidia at all-time highs, an under-the-radar semiconductor supplier is dominating a critical AI component these giants can’t build without. Click here to access our free report one of our favorites growth stories.
Operating Margin
Operating margin is an important measure of profitability as it shows the portion of revenue left after accounting for all core expenses – everything from the cost of goods sold to advertising and wages. It’s also useful for comparing profitability across companies with different levels of debt and tax rates because it excludes interest and taxes.
CSG has done a decent job managing its cost base over the last five years. The company has produced an average operating margin of 10.3%, higher than the broader business services sector.
Analyzing the trend in its profitability, CSG’s operating margin decreased by 2.1 percentage points over the last five years. This raises questions about the company’s expense base because its revenue growth should have given it leverage on its fixed costs, resulting in better economies of scale and profitability.
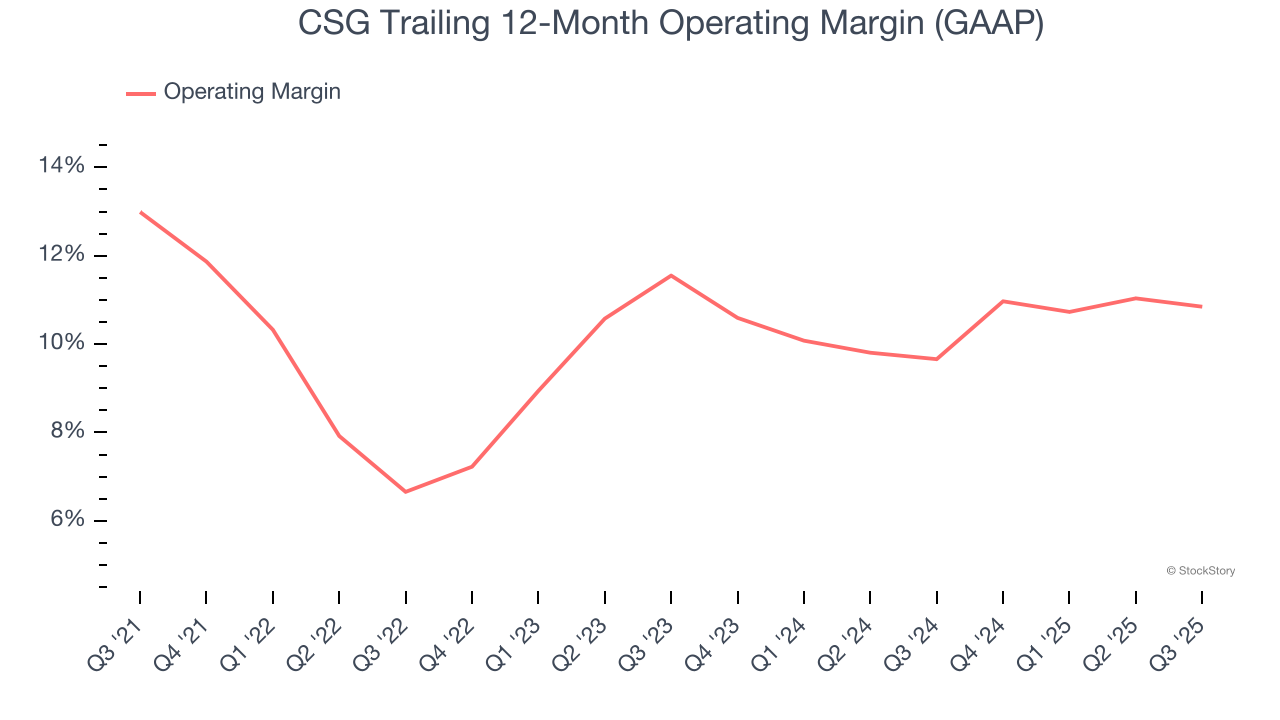
This quarter, CSG generated an operating margin profit margin of 10%, in line with the same quarter last year. This indicates the company’s overall cost structure has been relatively stable.
Earnings Per Share
Revenue trends explain a company’s historical growth, but the long-term change in earnings per share (EPS) points to the profitability of that growth – for example, a company could inflate its sales through excessive spending on advertising and promotions.
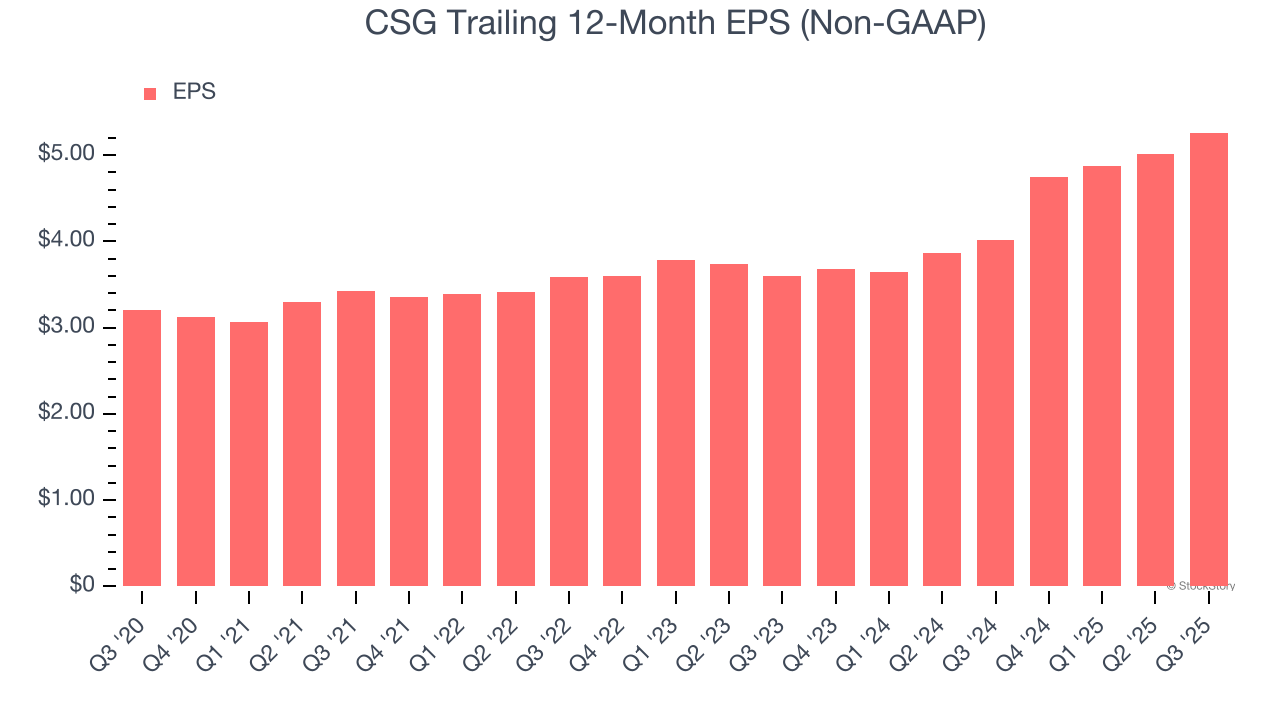
CSG’s EPS grew at a solid 10.5% compounded annual growth rate over the last five years, higher than its 4.3% annualized revenue growth. However, this alone doesn’t tell us much about its business quality because its operating margin didn’t improve.
Diving into the nuances of CSG’s earnings can give us a better understanding of its performance. A five-year view shows that CSG has repurchased its stock, shrinking its share count by 13.3%. This tells us its EPS outperformed its revenue not because of increased operational efficiency but financial engineering, as buybacks boost per share earnings. 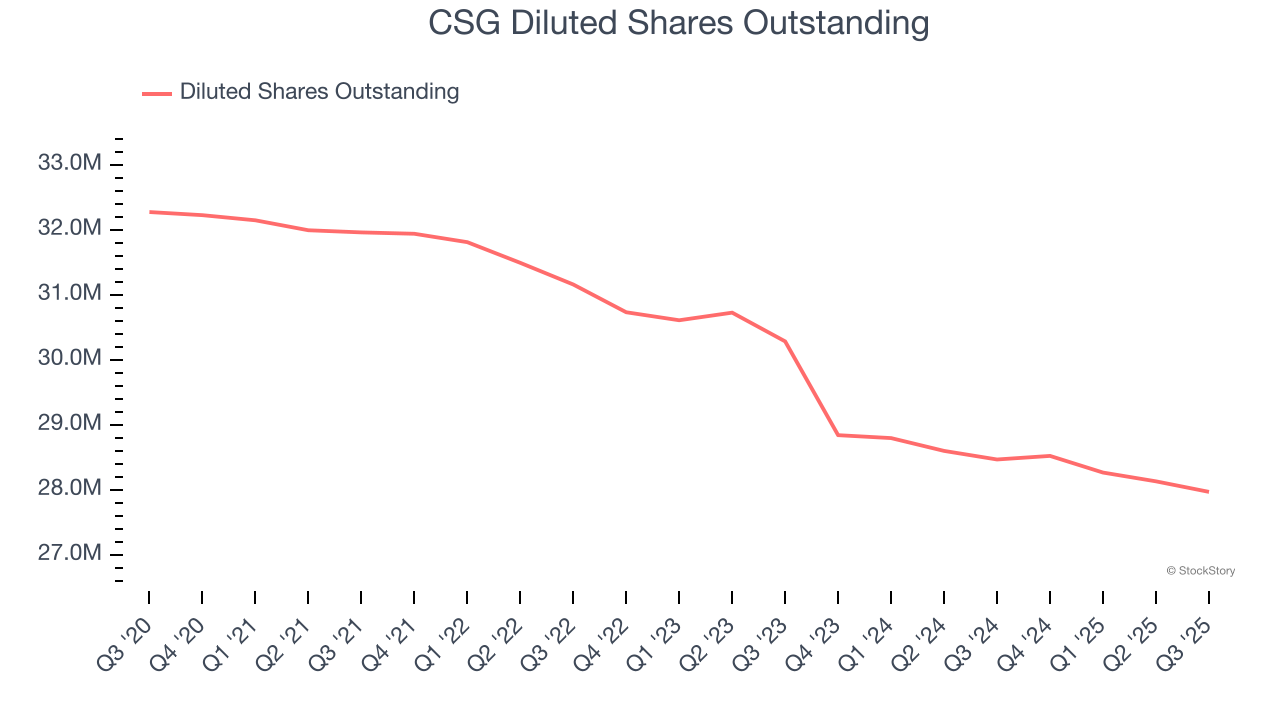
Like with revenue, we analyze EPS over a shorter period to see if we are missing a change in the business.
For CSG, its two-year annual EPS growth of 20.9% was higher than its five-year trend. We love it when earnings growth accelerates, especially when it accelerates off an already high base.
In Q3, CSG reported adjusted EPS of $1.31, up from $1.06 in the same quarter last year. This print easily cleared analysts’ estimates, and shareholders should be content with the results. Over the next 12 months, Wall Street expects CSG’s full-year EPS of $5.26 to shrink by 4.8%.
Key Takeaways from CSG’s Q3 Results
It was good to see CSG beat analysts’ EPS expectations this quarter. On the other hand, its revenue was in line. Zooming out, we think this quarter was fine. The stock remained flat at $78.78 immediately after reporting.
CSG had an encouraging quarter, but one earnings result doesn’t necessarily make the stock a buy. Let’s see if this is a good investment. What happened in the latest quarter matters, but not as much as longer-term business quality and valuation, when deciding whether to invest in this stock. We cover that in our actionable full research report which you can read here, it’s free for active Edge members.
More News
View More


Recent Quotes
View More
Quotes delayed at least 20 minutes.
By accessing this page, you agree to the Privacy Policy and Terms Of Service.