


Financial News
Banner Bank (NASDAQ:BANR) Surprises With Q3 Sales, Stock Soars

Regional banking company Banner Corporation (NASDAQ: BANR) reported Q3 CY2025 results beating Wall Street’s revenue expectations, with sales up 11% year on year to $170.7 million. Its GAAP profit of $1.54 per share was 10% above analysts’ consensus estimates.
Is now the time to buy Banner Bank? Find out by accessing our full research report, it’s free for active Edge members.
Banner Bank (BANR) Q3 CY2025 Highlights:
- Net Interest Income: $150 million vs analyst estimates of $149.7 million (10.6% year-on-year growth, in line)
- Net Interest Margin: 4% vs analyst estimates of 4% (in line)
- Revenue: $170.7 million vs analyst estimates of $168.9 million (11% year-on-year growth, 1.1% beat)
- Efficiency Ratio: 61.8% vs analyst estimates of 59.8% (199.4 basis point miss)
- EPS (GAAP): $1.54 vs analyst estimates of $1.40 (10% beat)
- Tangible Book Value per Share: $44.79 vs analyst estimates of $44.29 (8.9% year-on-year growth, 1.1% beat)
- Market Capitalization: $2.21 billion
“Banner’s third quarter performance reflects the continued strength of our super community bank strategy, which focuses on building client relationships, preserving a strong funding base, and delivering exceptional service while sustaining a moderate risk profile,” said Mark Grescovich, President and CEO.
Company Overview
Founded in 1890 in Walla Walla, Washington, and evolving through more than a century of economic cycles, Banner Corporation (NASDAQ: BANR) operates Banner Bank, providing commercial banking services, loans, and financial products to individuals and businesses across Washington, Oregon, California, Idaho, and Utah.
Sales Growth
Two primary revenue streams drive bank earnings. While net interest income, which is earned by charging higher rates on loans than paid on deposits, forms the foundation, fee-based services across banking, credit, wealth management, and trading operations provide additional income. Unfortunately, Banner Bank’s 2.6% annualized revenue growth over the last five years was tepid. This fell short of our benchmarks and is a poor baseline for our analysis.
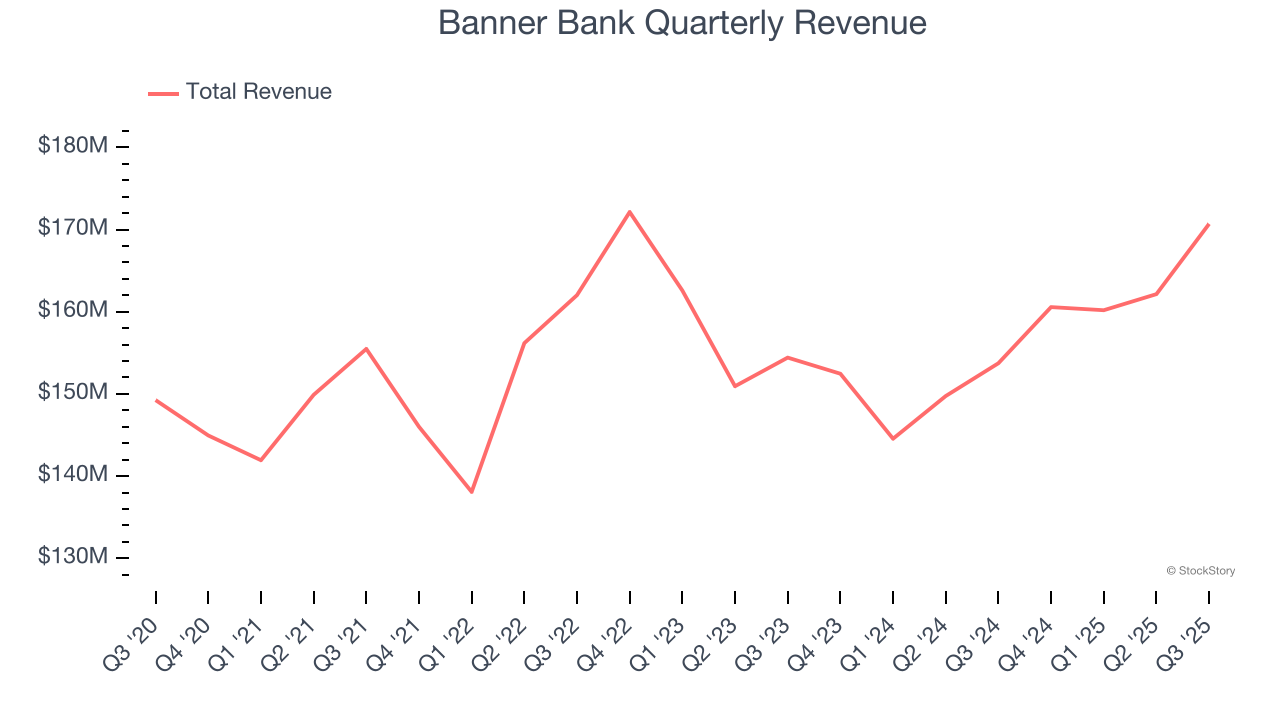
We at StockStory place the most emphasis on long-term growth, but within financials, a half-decade historical view may miss recent interest rate changes, market returns, and industry trends. Banner Bank’s recent performance shows its demand has slowed as its annualized revenue growth of 1.1% over the last two years was below its five-year trend. 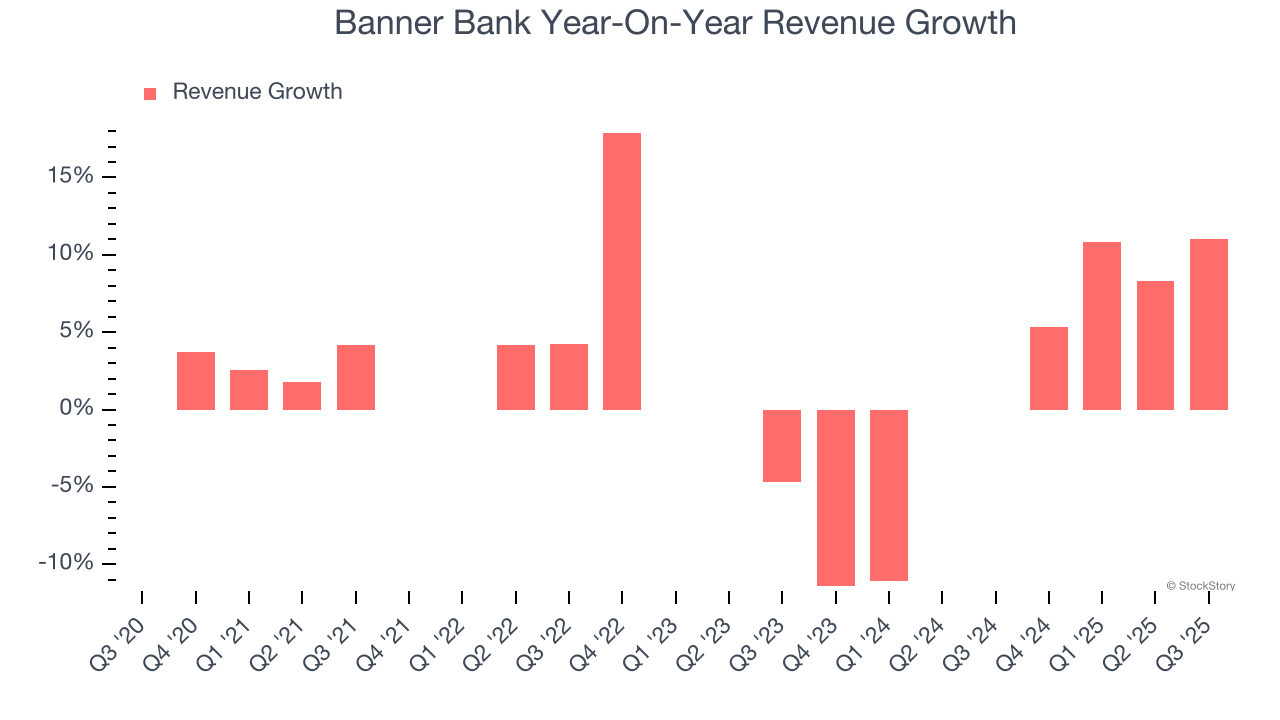 Note: Quarters not shown were determined to be outliers, impacted by outsized investment gains/losses that are not indicative of the recurring fundamentals of the business.
This quarter, Banner Bank reported year-on-year revenue growth of 11%, and its $170.7 million of revenue exceeded Wall Street’s estimates by 1.1%.
Net interest income made up 88.1% of the company’s total revenue during the last five years, meaning Banner Bank barely relies on non-interest income to drive its overall growth.
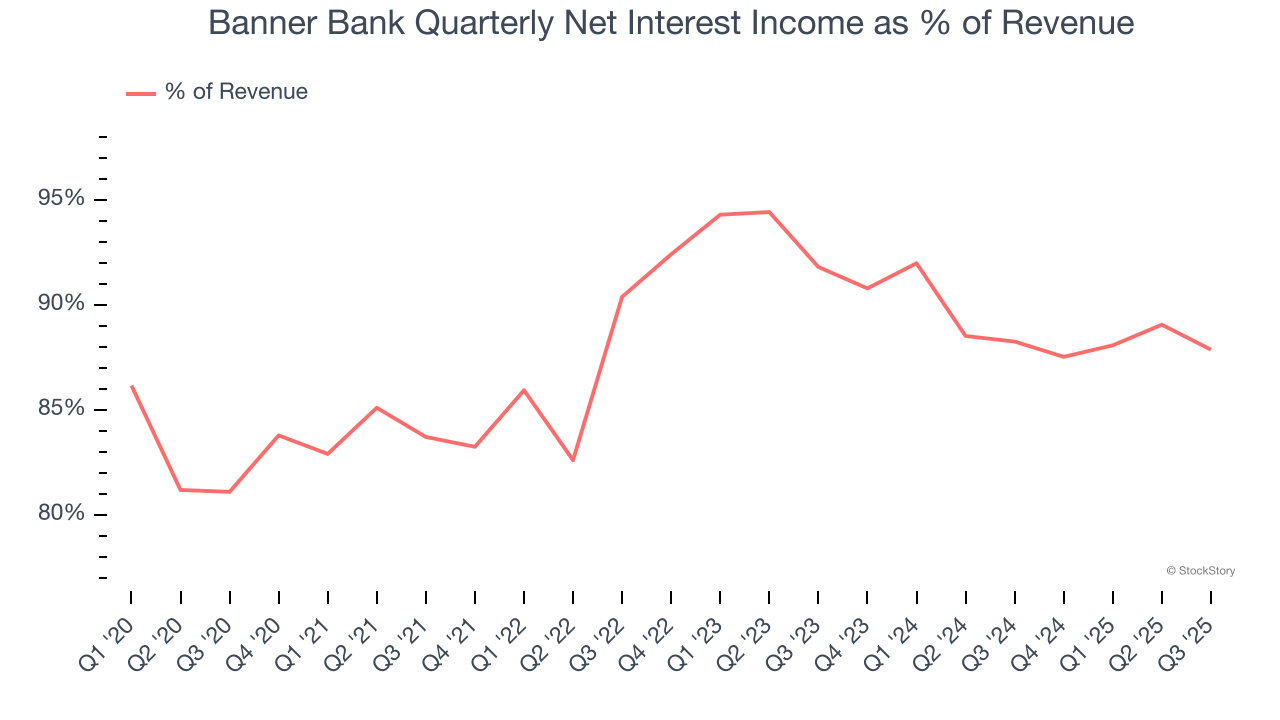
While banks generate revenue from multiple sources, investors view net interest income as the cornerstone - its predictable, recurring characteristics stand in sharp contrast to the volatility of non-interest income.
Software is eating the world and there is virtually no industry left that has been untouched by it. That drives increasing demand for tools helping software developers do their jobs, whether it be monitoring critical cloud infrastructure, integrating audio and video functionality, or ensuring smooth content streaming. Click here to access a free report on our 3 favorite stocks to play this generational megatrend.
Tangible Book Value Per Share (TBVPS)
Banks operate as balance sheet businesses, with profits generated through borrowing and lending activities. Valuations reflect this reality, emphasizing balance sheet strength and long-term book value compounding ability.
This explains why tangible book value per share (TBVPS) stands as the premier banking metric. TBVPS strips away questionable intangible assets, revealing concrete per-share net worth that investors can trust. Other (and more commonly known) per-share metrics like EPS can sometimes be murky due to M&A or accounting rules allowing for loan losses to be spread out.
Banner Bank’s TBVPS grew at a mediocre 4.7% annual clip over the last five years. However, TBVPS growth has accelerated recently, growing by 16.1% annually over the last two years from $33.22 to $44.79 per share.
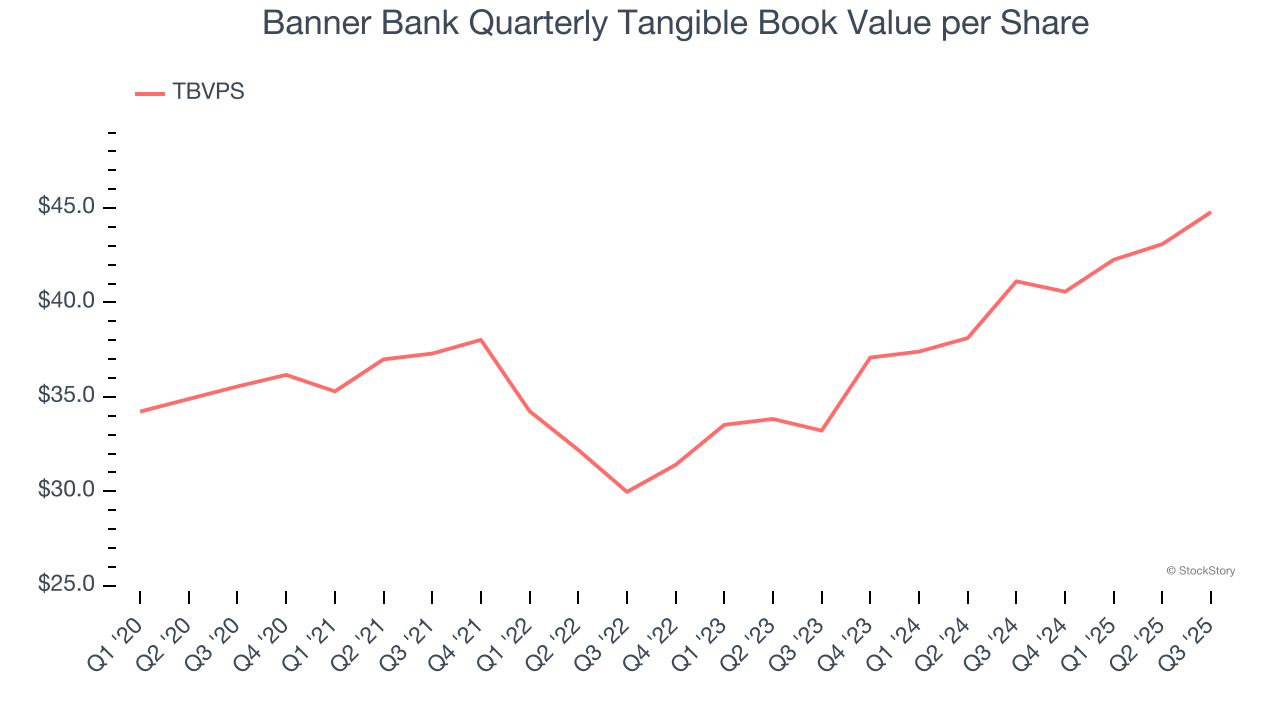
Over the next 12 months, Consensus estimates call for Banner Bank’s TBVPS to grow by 8.7% to $48.67, decent growth rate.
Key Takeaways from Banner Bank’s Q3 Results
It was good to see Banner Bank beat analysts’ EPS expectations this quarter. We were also happy its tangible book value per share narrowly outperformed Wall Street’s estimates. Overall, this print had some key positives. The stock traded up 6.1% to $66.50 immediately following the results.
Indeed, Banner Bank had a rock-solid quarterly earnings result, but is this stock a good investment here? When making that decision, it’s important to consider its valuation, business qualities, as well as what has happened in the latest quarter. We cover that in our actionable full research report which you can read here, it’s free for active Edge members.
More News
View More


Recent Quotes
View MoreQuotes delayed at least 20 minutes.
By accessing this page, you agree to the Privacy Policy and Terms Of Service.