


Financial News
S&P 500 Eyes the 7,000 Milestone: Technical Breakout or Psychological Ceiling?
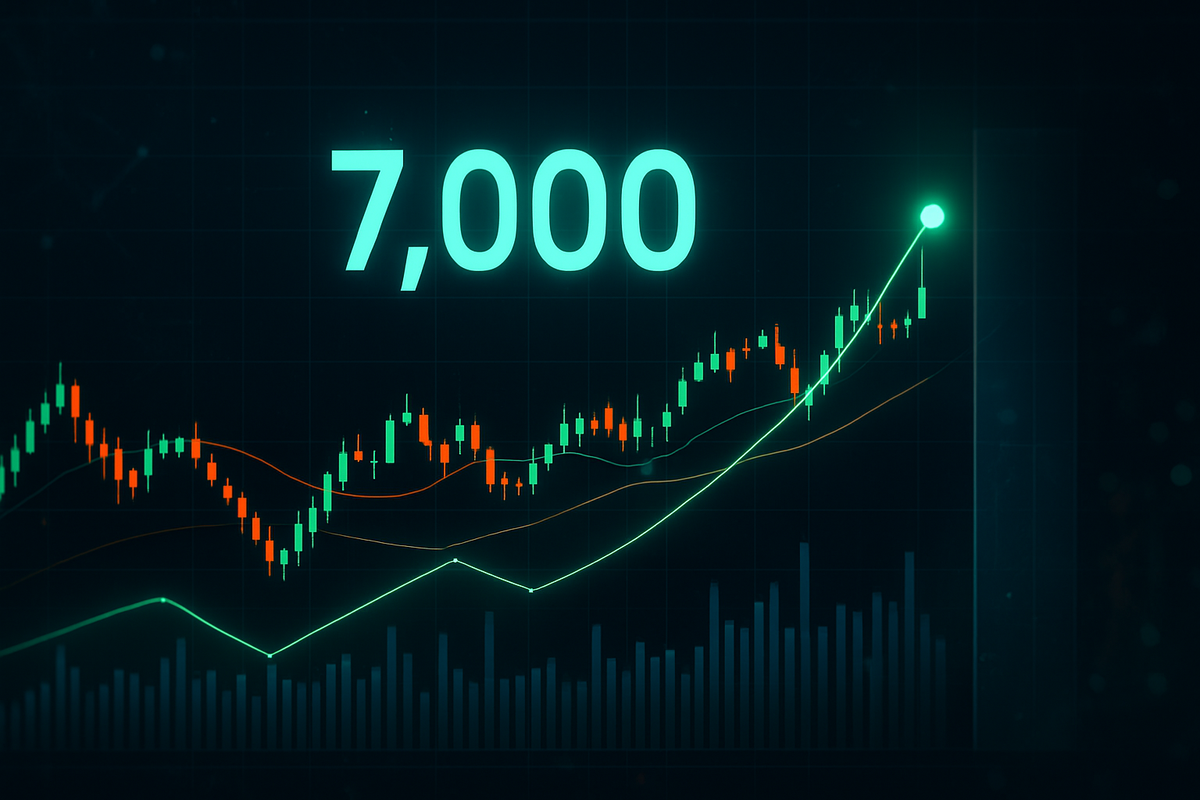
The financial world is collectively holding its breath as the S&P 500 (NYSEARCA: SPY) hovers at 6,979, just a stone's throw away from the psychologically momentous 7,000-point milestone. After a volatile start to 2026, technical analysts are laser-focused on whether the index can punch through this "Gamma Wall" with the necessary volume to sustain a new leg of the bull market. The stakes are high; a successful breach could validate the current "AI Capex Super-Cycle," while a failure to hold support at 6,800 could trigger a long-awaited 10% correction.
As of January 28, 2026, the market is navigating a complex landscape of cooling inflation and a Federal Reserve that has transitioned from aggressive tightening to a steady easing cycle. While the momentum remains ostensibly bullish, the high concentration of gains in a handful of technology titans has left the broader market vulnerable. Investors are now looking for "volume confirmation"—a decisive surge in trading activity—to prove that this rally has the institutional backing to survive at these record-breaking valuations.
The Journey to 7,000: A Path Paved with Volatility
The S&P 500’s ascent to its current levels followed a blockbuster 2025, which saw the index return roughly 18%. However, the path in January 2026 has been anything but linear. Just a week ago, on January 20, the market suffered a sharp 2% intraday drop fueled by sudden geopolitical friction over Greenland tariffs and shifting monetary signals from the Bank of Japan. This brief "flash dip" tested the resolve of many retail investors, but the index quickly found its footing, rebounding toward the 7,000 resistance level.
Technical analysts point to the 7,000 mark not just as a round number, but as a critical Fibonacci extension level derived from the early 2025 correction. This level represents a point where dealer positioning is heavily concentrated, often acting as a "ceiling" unless a significant fundamental catalyst—such as a blowout earnings season—provides the necessary lift. Currently, the index is trading just above its 20-day Simple Moving Average (SMA) of 6,858, which is serving as a short-term pivot point for momentum traders.
The primary floor for the current market structure is firmly set at 6,800. This zone is reinforced by the 50-day SMA, which currently sits at 6,790. A breach below this support, particularly the December 2025 lows near 6,720, would be viewed by many as a signal that the year-end rally has finally exhausted itself. For now, the "Put/Call Ratio" remains elevated between 1.11 and 1.30, suggesting that while the market is climbing, institutional players are aggressively hedging their bets against a potential reversal.
Winners and Losers: The AI Engines Driving the Index
The current technical outlook is inseparable from the performance of the "Magnificent 7," which now collectively account for over one-third of the S&P 500's total market capitalization. Leading the charge is NVIDIA (NASDAQ: NVDA), which remains the primary engine of the index with a weight fluctuating between 7% and 12% depending on daily valuations. For investors, NVIDIA’s quarterly reports have moved beyond simple corporate earnings and are now treated as "macro events" that dictate the direction of the entire semiconductor sector and the broader S&P 500.
Microsoft (NASDAQ: MSFT), holding a 10.63% weight, is widely regarded as the best-positioned titan to capitalize on the AI infrastructure boom of 2026. Its integrated cloud and AI services continue to provide the fundamental justification for its high forward P/E ratio. Conversely, Apple (NASDAQ: AAPL), despite its massive 11.88% weight, has faced more technical struggle in early 2026. While it remains a cornerstone of many portfolios, it has lagged behind its peers as investors demand more clarity on its long-term AI hardware integration and services growth.
While the "AI winners" have thrived, the broader market has seen a mixed bag. Smaller-cap companies and traditional cyclicals have only recently begun to see a rotation of capital in their direction. If the S&P 500 breaks above 7,000, these lagging sectors may finally join the rally. However, if the index fails and retreats toward 6,800, the high-flying tech stocks—the very ones that led the market up—could see the most aggressive profit-taking, leaving the "passive" investors in index funds particularly exposed.
Wider Significance: The AI Super-Cycle and Historical Precedents
This battle at the 7,000 level is more than just a technical skirmish; it is a referendum on the "AI Capex Super-Cycle." With earnings growth for 2026 projected at 12% to 14.8%, the market is currently pricing in a near-perfect economic scenario. This mirrors historical periods of rapid technological expansion, such as the late 1990s or the post-war industrial boom, where valuations expanded rapidly ahead of realized productivity gains.
The Federal Reserve’s role cannot be overstated. With the fed funds rate currently sitting at 3.50%–3.75%, the "Fed Tailwind" is providing a cushion for the market’s high P/E ratios, which are currently hovering around 22x forward earnings. Historically, when the Fed transitions to a cutting cycle while the economy is still growing—as it is now with a GDP forecast of 2.0% to 2.5%—the S&P 500 has often seen extended periods of growth, though rarely without significant technical pullbacks at major milestones like 7,000.
However, the concentration risk remains a glaring outlier compared to historical norms. Never before has the S&P 500 been so dependent on such a small number of companies. This has created a "show me" phase for the index, where institutional firms are demanding a daily close above 6,960 with elevated trading volume to confirm that the breakout is genuine. Without this volume confirmation, the risk of a "bull trap"—where the market briefly breaks a level only to collapse back below it—remains high.
What Comes Next: Scenarios for the Spring of 2026
In the short term, the market's direction will likely be determined by the upcoming batch of February earnings reports and the Fed's next policy meeting. If the major tech players can exceed their lofty 14% earnings growth targets, the momentum could easily carry the S&P 500 toward a target of 7,200 by mid-year. In this bullish scenario, the 7,000 level would transform from a ceiling into a sturdy floor of support.
Alternatively, if volume remains thin and retail participation continues to dominate (recent data showed retail trading hitting a staggering $4 billion in a single day), a mean-reversion event becomes increasingly likely. A retreat to 6,800 would be the first sign of trouble, potentially leading to a deeper correction toward the 200-day moving average if geopolitical tensions or "sticky" inflation data (Core CPI currently at 2.65%) unsettle the bond market.
Investors should also watch for a potential strategic pivot in market leadership. If the S&P 500 manages to break 7,000, we may see a more "healthy" rally where mid-cap and value stocks begin to shoulder more of the burden. This broadening of the rally would be a signal of a more durable bull market, whereas a rally led exclusively by NVIDIA and Microsoft would continue to raise alarms about a potential bubble.
Wrap-Up: Navigating the 7,000 Frontier
The S&P 500’s approach to 7,000 is a watershed moment for the 2026 market. The index has proven resilient in the face of geopolitical shocks and shifting interest rates, but the final push through this psychological barrier requires more than just sentiment—it requires cold, hard volume and continued earnings excellence. The 6,800 level remains the line in the sand; as long as the index stays above this support, the structural bull case remains intact.
Moving forward, the primary takeaways for investors are the importance of volume confirmation and the looming shadow of concentration risk. While the "AI Super-Cycle" provides a powerful fundamental base, the market’s extreme sensitivity to a few key stocks means that volatility will remain a constant companion. The coming months will determine if 7,000 is a peak to be feared or a base camp for the next leg of the journey.
Investors should keep a close eye on the 50-day SMA and the daily closing volume at the 7,000 mark. In a market where record highs have become the norm, the ability to distinguish between a sustainable breakout and a temporary spike will be the key to navigating the rest of 2026.
This content is intended for informational purposes only and is not financial advice
More News
View More

Recent Quotes
View MoreQuotes delayed at least 20 minutes.
By accessing this page, you agree to the Privacy Policy and Terms Of Service.