


Financial News
Market Alarms Blare: Buffett Indicator and Shiller CAPE Ratio Signal Potential 2026 Stock Market Crash
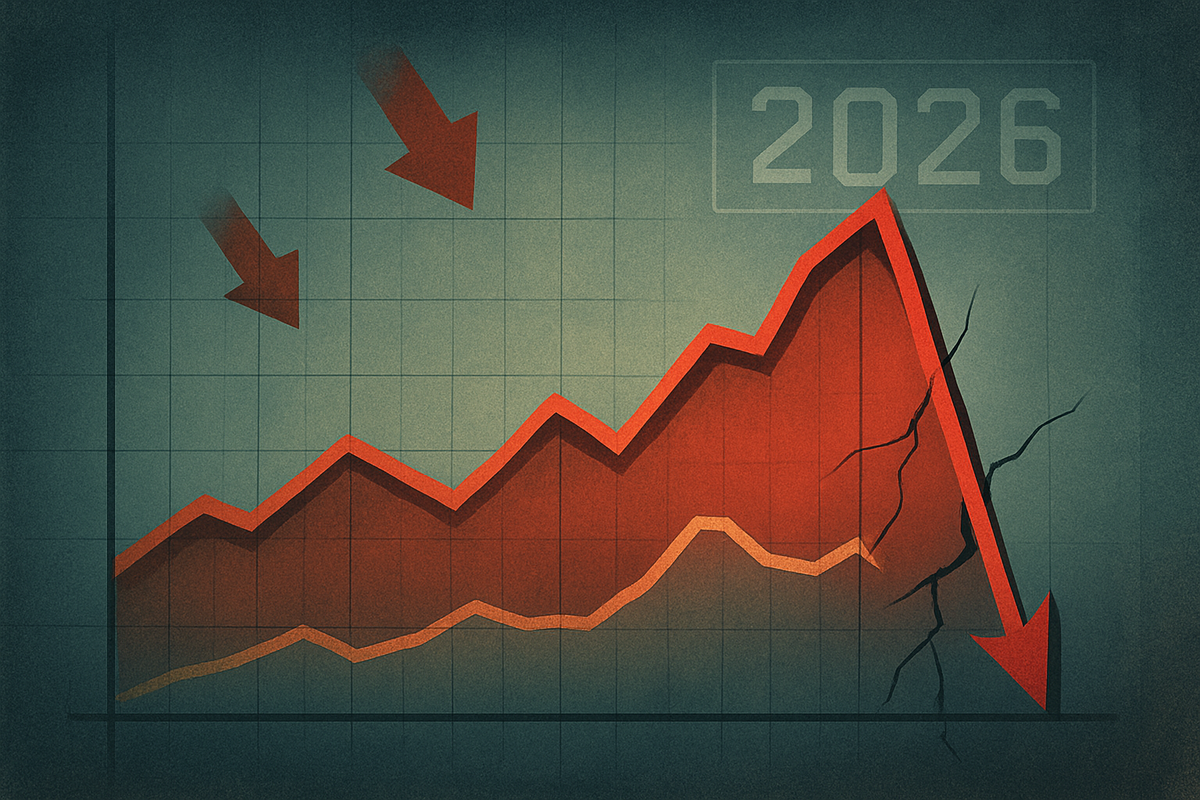
As the calendar turns towards late 2025, prominent valuation metrics, the "Buffett Indicator" and the "Shiller CAPE Ratio," are flashing crimson, sending strong signals of a potentially significant stock market correction or even a crash looming in 2026. These historically reliable gauges of market health suggest that current equity valuations are stretched to unsustainable levels, prompting investors and analysts alike to brace for a period of turbulence. The confluence of these warnings from two distinct yet respected indicators paints a concerning picture for the immediate future of the financial markets.
The immediate implication of these elevated readings is a heightened risk of lower-than-average returns, or even negative returns, for the U.S. stock market over the next 5 to 10 years. With valuations reminiscent of past market tops, the current environment suggests that investors are paying a premium far beyond historical norms for corporate earnings and underlying economic output. This overextension leaves the market vulnerable to any negative catalysts, whether economic slowdowns, interest rate hikes, or geopolitical shocks, setting the stage for a potentially volatile year ahead.
Unpacking the Warning Signs: Historic Highs and Alarming Parallels
The "Buffett Indicator," formally known as the Market Capitalization-to-GDP ratio, compares the total value of all publicly traded stocks to a country's Gross Domestic Product. Championed by legendary investor Warren Buffett as "probably the best single measure of where valuations stand at any given moment," this metric serves as a broad gauge of market valuation against the size of the overall economy. As of October 2025, the Buffett Indicator has soared to unprecedented levels, hovering around 219% to 224.7%. This is significantly above its historical average of 80% to 100%, and well past the 115% mark that typically signals overvaluation. Buffett himself has warned that levels exceeding 200% mean investors are "playing with fire." The current surge is partly attributed to the robust performance of the technology sector, particularly driven by the artificial intelligence (AI) boom, raising concerns about a speculative bubble.
Similarly, the Shiller Cyclically Adjusted Price-Earnings (CAPE) Ratio, developed by Nobel laureate Robert Shiller, provides a long-term valuation perspective by dividing the current price of the S&P 500 index by the 10-year moving average of its inflation-adjusted earnings. This smoothing mechanism aims to mitigate the impact of short-term earnings volatility. As of October 2025, the Shiller CAPE Ratio is alarmingly high, ranging from 39.51 to 40.35. This places it at its second-highest level ever, trailing only the peak of 44.2 observed just before the dot-com bubble burst in 1999-2000. Its long-term historical average is around 16.03, highlighting the extreme overvaluation currently present. The consistent rise in both indicators over the past few years, particularly accelerating in 2024 and 2025, underscores a market increasingly detached from historical valuation norms. Key stakeholders, from individual investors to institutional fund managers, are now grappling with the implications of these dire warnings. Initial market reactions have been mixed; while some analysts dismiss these as "perma-bear" warnings, a growing chorus of financial strategists is advising caution and portfolio de-risking.
Potential Winners and Losers in a Market Downturn
Should these indicators prove accurate and a market correction or crash materialize in 2026, the impact on public companies will be uneven, creating distinct winners and losers across sectors.
Potential Losers: Companies with high valuations, particularly those in the growth and technology sectors, which have driven much of the recent market rally, stand to lose the most. Highly leveraged companies across various industries would also be vulnerable as tighter credit conditions or reduced consumer spending could severely impact their ability to service debt. Examples include many of the "Magnificent Seven" tech giants like Apple (NASDAQ: AAPL), Amazon (NASDAQ: AMZN), and NVIDIA (NASDAQ: NVDA), whose valuations have soared on future growth expectations rather than immediate earnings. Companies heavily reliant on discretionary consumer spending, such as luxury retailers or travel and leisure companies, could also see significant declines as consumers tighten their belts.
Potential Winners (or less impacted): In contrast, defensive sectors are typically more resilient during market downturns. Companies in consumer staples, utilities, and healthcare tend to perform better as their products and services remain essential regardless of economic conditions. Examples include Procter & Gamble (NYSE: PG), Coca-Cola (NYSE: KO), Johnson & Johnson (NYSE: JNJ), and utility providers like NextEra Energy (NYSE: NEE). These companies often offer stable dividends and less volatile earnings, making them attractive havens for investors seeking safety. Furthermore, companies with strong balance sheets, low debt, and robust free cash flow would be better positioned to weather a downturn and potentially acquire distressed assets at attractive valuations.
Broader Implications and Historical Echoes
The current signals from the Buffett Indicator and Shiller CAPE Ratio fit into a broader narrative of market concentration, inflation concerns, and evolving monetary policy. The significant portion of the market's gains driven by a handful of large-cap technology stocks, often dubbed the "Magnificent Seven," mirrors historical patterns seen before market tops, where a narrow group of companies leads the charge. This market concentration, combined with persistent inflationary pressures and the Federal Reserve's cautious stance on interest rate adjustments, creates a precarious environment.
A market downturn could trigger ripple effects across other asset classes. A significant equity correction could lead to a "flight to safety," increasing demand for government bonds and potentially driving down yields. Real estate markets, particularly those already showing signs of cooling, could face further pressure as investor confidence wanes and credit tightens. Commodities might see varied reactions; industrial commodities could decline due to reduced demand, while safe-haven commodities like gold could surge. Historically, the accuracy of these indicators provides sobering context. The Buffett Indicator famously approached 200% just before the dot-com bubble burst in 2000 and peaked before the Great Financial Crisis. The Shiller CAPE Ratio's highest value ever in 1999-2000 directly preceded the dot-com bust, and its spike in 1929 foreshadowed the Great Depression's market crash. While not perfect timing tools, their consistent warnings before major market events underscore their significance. Regulatory bodies and central banks, such as the Federal Reserve, would face immense pressure to intervene with monetary policy adjustments, potentially including interest rate cuts or quantitative easing, to stabilize markets and the broader economy, though their efficacy in an already inflated market remains a subject of debate.
Navigating the Road Ahead: Scenarios and Strategic Pivots
Looking ahead, the market faces several potential scenarios, ranging from a sharp, short-lived correction to a prolonged bear market, or even, less likely, a "soft landing" where valuations gradually normalize without a severe downturn. In the short term, increased volatility is almost certain. Investors should prepare for significant price swings and heightened uncertainty.
Strategically, market participants may need to make significant pivots. For individual investors, this could mean rebalancing portfolios away from overvalued growth stocks towards more defensive, value-oriented assets. Increasing cash positions could provide dry powder for future buying opportunities after a potential correction. For institutional investors and corporations, this might involve stress-testing balance sheets, reducing leverage, and focusing on capital preservation. Companies might also reconsider aggressive expansion plans in favor of shoring up existing operations. Market opportunities could emerge for contrarian investors willing to buy high-quality assets at discounted prices after a crash. Conversely, challenges include navigating increased risk, potential liquidity issues, and the psychological toll of a bear market. The emergence of new economic data, corporate earnings reports, and central bank communications will be critical in shaping the market's trajectory.
A Prudent Path Forward Amidst Market Warnings
In summary, the current readings of the Buffett Indicator and the Shiller CAPE Ratio present a compelling and historically significant warning for the stock market. Both metrics, known for their long-term predictive power, are signaling extreme overvaluation, reminiscent of periods preceding major market downturns. While the precise timing of a market correction remains elusive, the elevated risk environment suggests that investors should exercise extreme caution and adopt a defensive posture.
Moving forward, the market will likely be characterized by increased scrutiny of corporate earnings, sensitivity to economic data, and careful observation of central bank policy. Investors should watch for any signs of a slowdown in corporate profitability, particularly among the high-flying tech stocks, and monitor inflation trends closely. Geopolitical developments and their potential impact on global supply chains and economic stability will also be key factors. Ultimately, the lasting impact of these warnings could reshape investor behavior, leading to a greater emphasis on fundamental value and risk management over speculative growth. Prudence, diversification, and a long-term perspective will be paramount for navigating the challenging months and years ahead.
This content is intended for informational purposes only and is not financial advice
More News
View More


Recent Quotes
View More
Quotes delayed at least 20 minutes.
By accessing this page, you agree to the Privacy Policy and Terms Of Service.