


Financial News
Forget NVDA. This 1 Stronger Tech Stock Can Survive and Thrive in a Selloff. How to Trade It With Options Now.
Tech stocks of all varieties have been this month’s stock market “turkeys.” And when I went through the holdings of the S&P 500 Technology Sector SPDR ETF (XLK), an $88 billion fund topped by so many longtime investor favorites, it was not easy to find encouraging charts.
But it all depends on the time frame. I don’t have a very positive outlook for tech, or stocks in general, on an intermediate to long-term basis. However, there’s always a trade to be had.
So, I went looking for stocks within XLK that might offer a solid combination of near-term upside potential with a longer-term chart pattern that provided a reasonable cushion.
Now, any ETF and the stocks within it can go higher at any time. But how much risk is attached to trying to make that profit? That’s what I ask myself all day, every day, scanning charts using Barchart. And with the tools here, I get a great view, and very quickly.
So before diving into the specific stock holdings within XLK, I looked at the chart of the ETF itself. Here it is, and I don’t like it. Again, that means I think risk is still high following the recent drop. That doesn’t mean it can’t just pick up where it left off a few weeks ago. But it is far from a slam dunk.
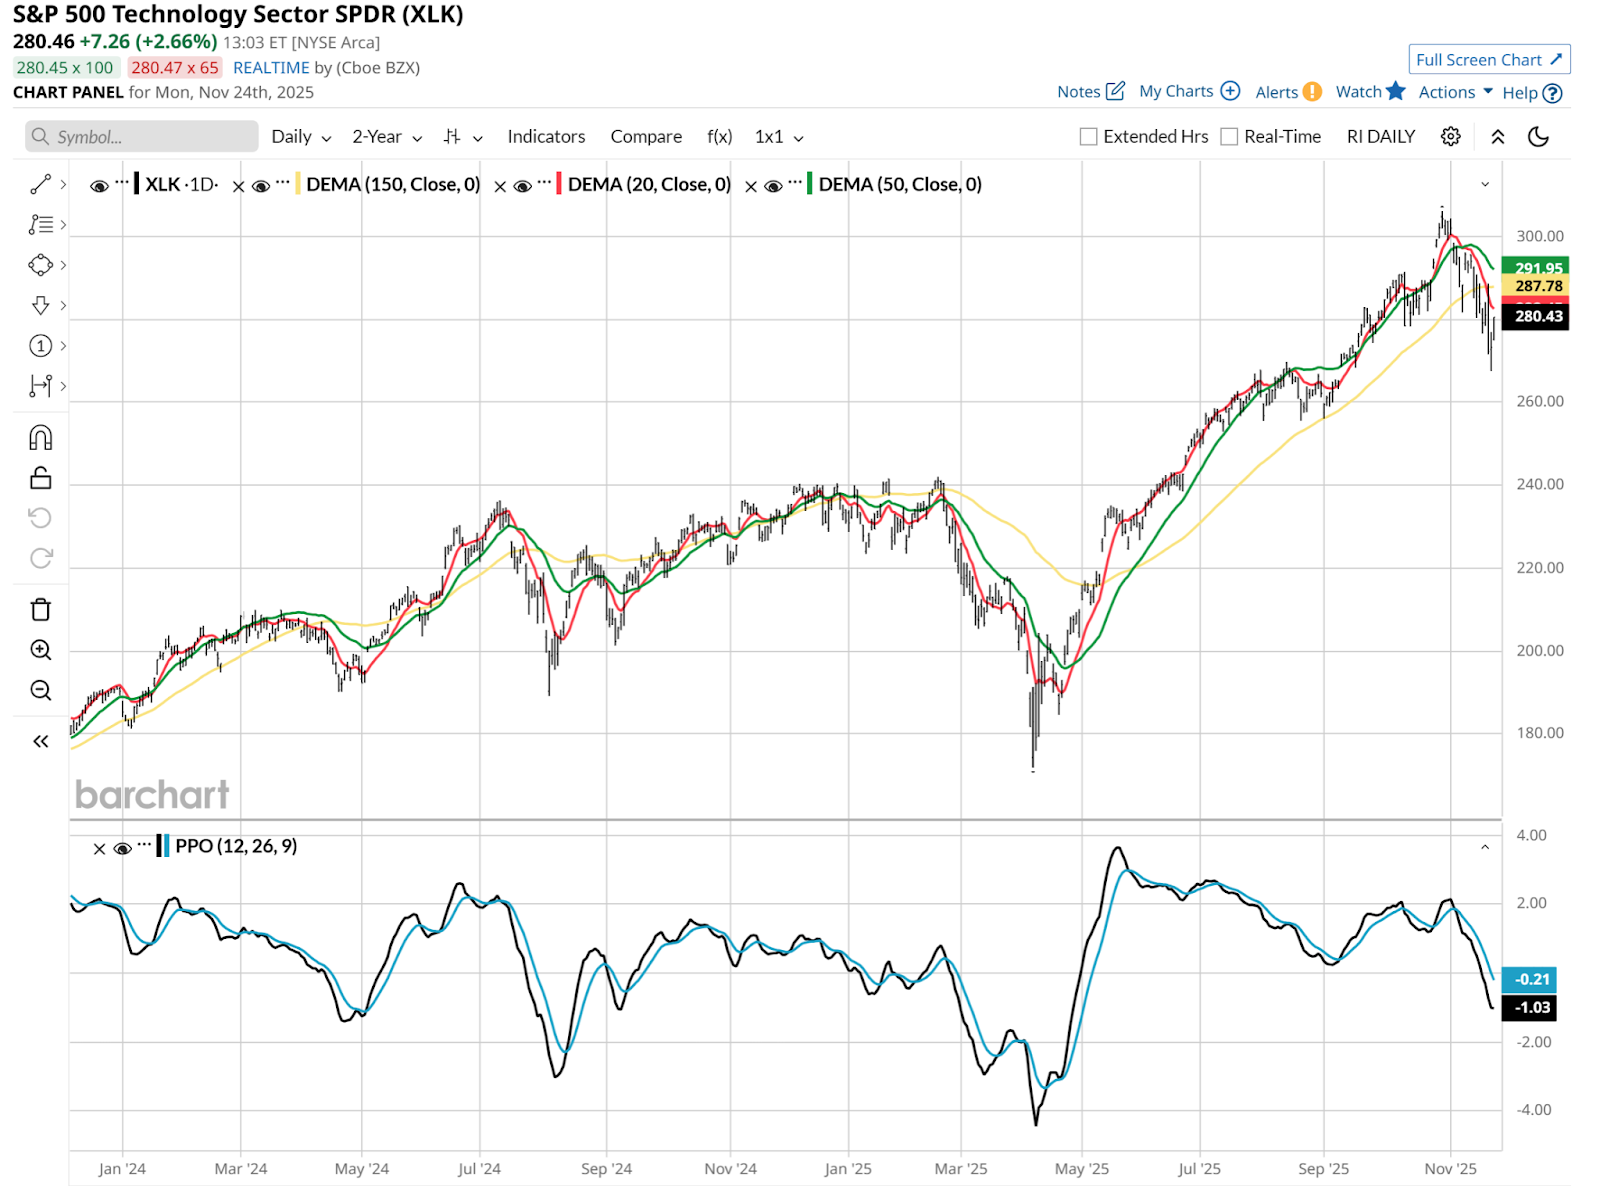
Part of my skepticism is that the weekly chart, shown below, essentially looks like a slow-motion version of the daily. The Percentage Price Oscillator (PPO) indicator has broken down, as the black line has crossed down through the blue line. And the 20-week moving average (top section of the chart below) is just starting to roll over, following that same pattern from the daily view above.

This all spells high risk. But not zero return potential. In fact, far from it in a market still jacked up on tech stocks.
But XLK’s predicament in a technical fashion is not necessarily that of all of its component stocks. While it contains more than 70 large-cap tech stocks, just 10 of them account for more than 62% of assets.
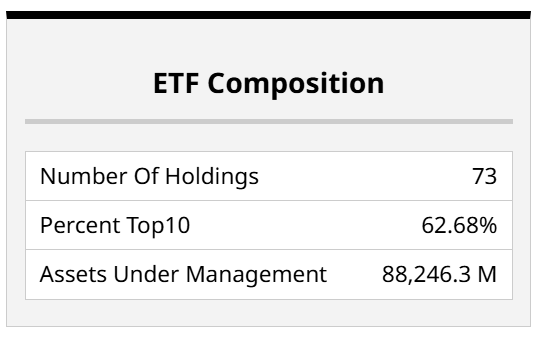
So if we do some quick math, we realize that XLK is going to be heavily influenced by those top 10 tech giants. But that also means there could be smaller stocks within this ETF that could have their own, individual bullish moves. It would not move the index ETF much. But if the stock is what one owns, not the ETF, that doesn’t matter.
Here are the top 22 holdings of XLK. Why 22? Because it took me that many to find a stock chart I liked. Again, beyond a quick trade. At times like this, they all tend to move in sync to some degree.
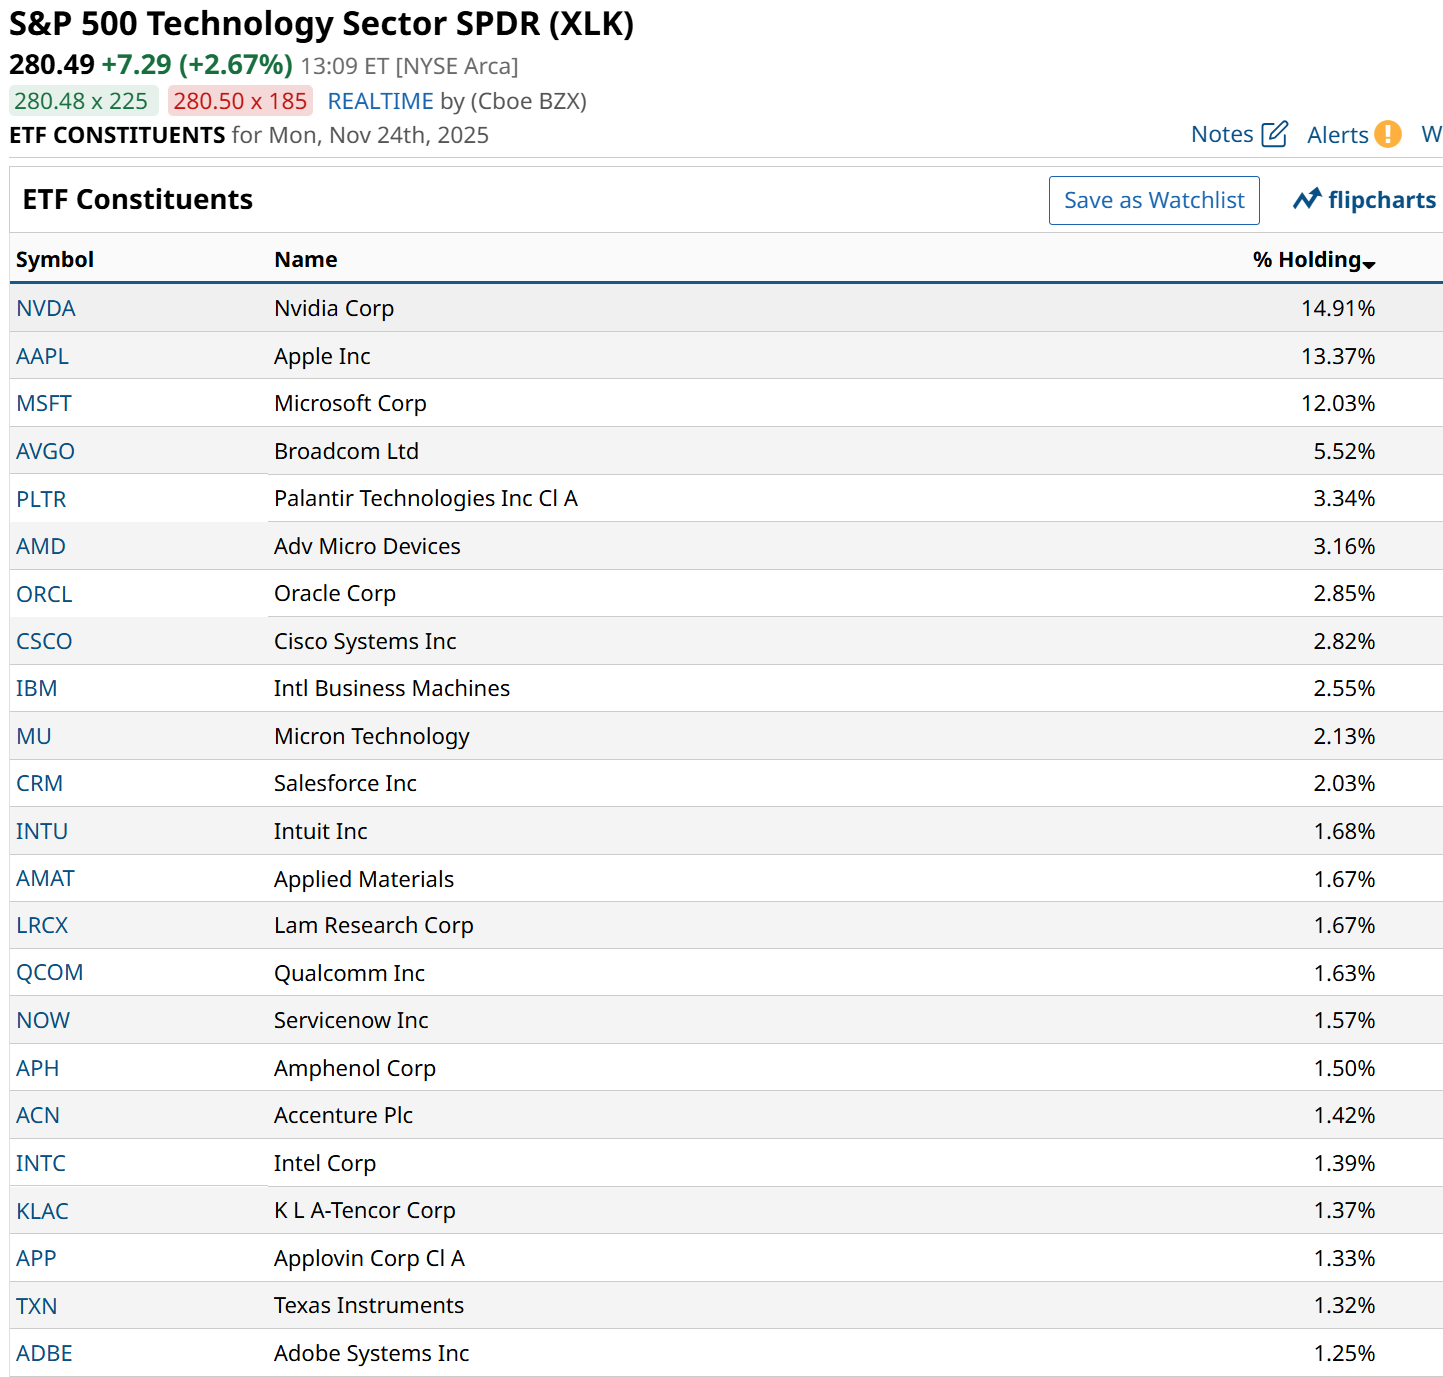
And I’m looking for one that can go its own way if the tech trade falls apart again. As I think it is more likely to do than continue to new highs.
That search for a tech stock landed me in Texas. Specifically, I found Texas Instruments (TXN), part of the old guard of tech, which some of us remember as the coolest device we had in school. The calculator. Imagine how much progress we’ve made based on that!
TXN is huge, at a market cap over $140 billion. If it were a basic materials company, the stock would be a clear No. 2 holding in that sector ETF based on its market capitalization. But it isn’t. It is in XLK, buried below the Magnificent 7 and others.

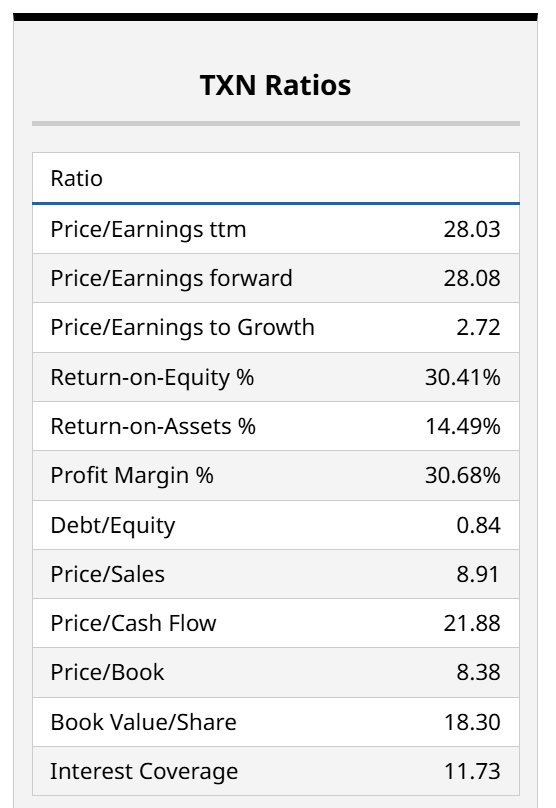
TXN’s price has gone exactly nowhere the past 5 years, as rivals with better growth have moved past it and attracted more investor interest. And at 28x earnings, both trailing and forward measures, it is nothing special valuation wise. In fact, selling at 2.7x its growth rate, and selling at nearly 9x sales, it is no bargain fundamentally.
But we have a chart, at least in daily format, which shows the stock having flattened out. That might shield it from a relapse in tech. This is more about relative value in chart terms. And the PPO at bottom is hinting at trying to move off that low level. So this is more anticipatory. That said, buying laggards has been a profitable approach for a long time.

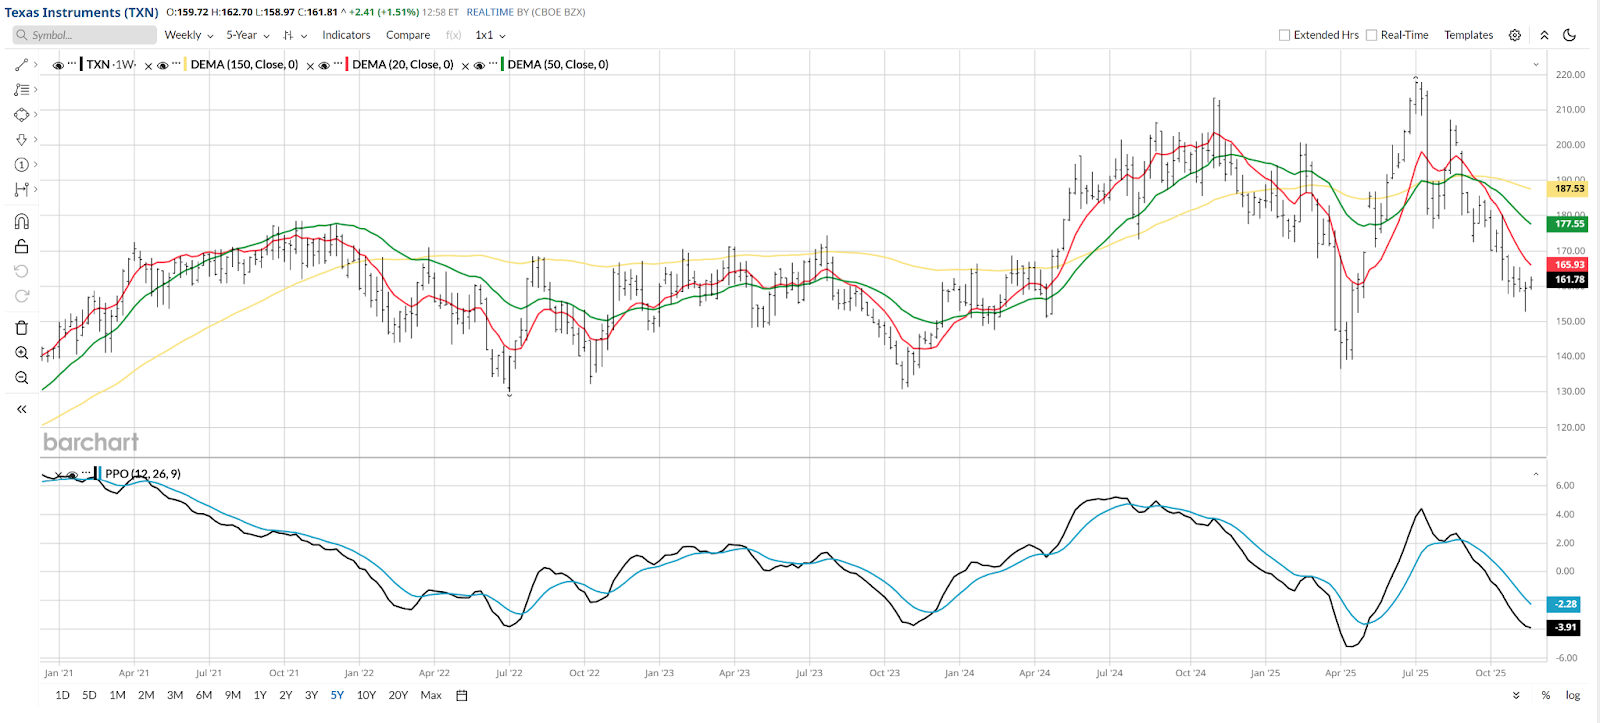
This weekly view is similar in PPO terms, just moving more slowly as a weekly chart will. But what I see here in very basic technical terms is a stock in a range, but toward the bottom of that range. The top of that range, around the July high level of nearly $220 a share, is 40% north of here. That could make a nice upside/downside tradeoff.
How to Play TXN Without Buying the Stock
In “needle in haystack” situations like this, I often look to call options. Not selling covered calls as many do for income. I’m talking about buying options as a surrogate for the stock. Here’s an example.
Since a lot can happen in just 4 weeks’ time, I looked out only to Dec. 19. Here’s a case where instead of spending $16,185 to buy 100 shares of TXN, I can buy 1 call option for $310.
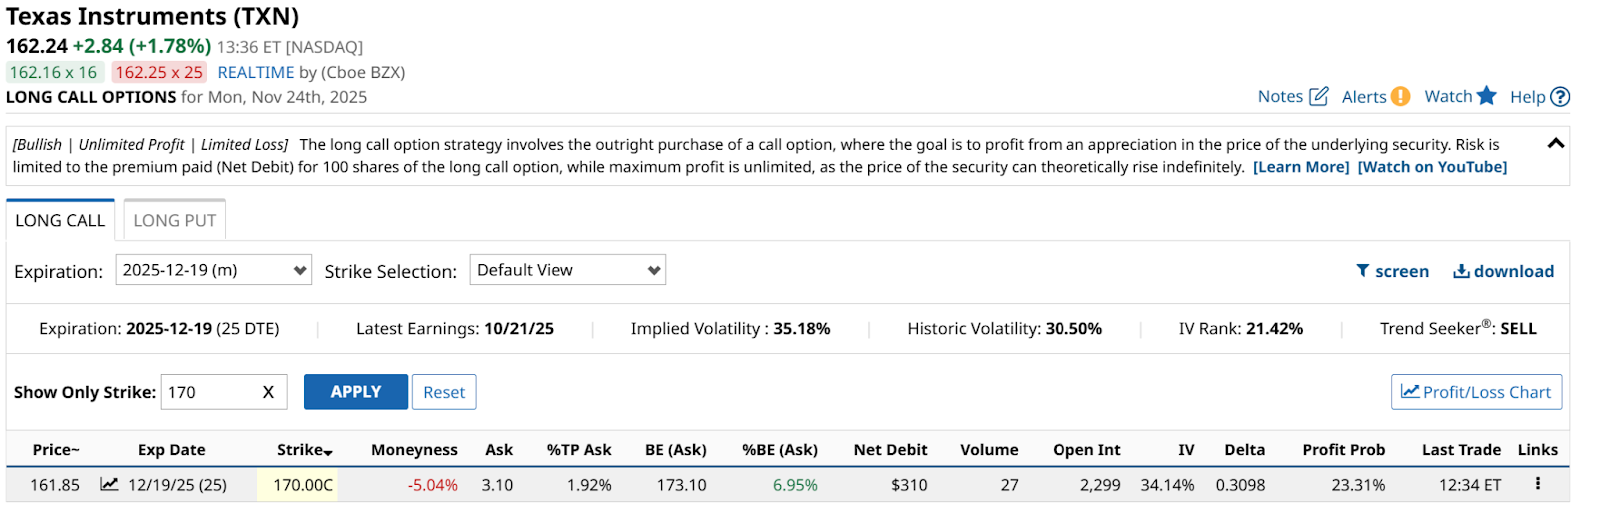
I chose a $170 strike price, about 5% out of the money, since I figure the stock either rallies during this time with the rest of tech, or it fails with the sector. In the latter case, I’m out $310. That’s it. I can’t lose more, since it's all I put up to buy the option. So it is like a losing lottery ticket.
Compare that to owning 100 shares, unhedged. Just a 10% drop in the stock from its $162 recent level would translate to a $1,620 loss. With no bottom in sight. So I like the tradeoff here.
On the upside, if the stock goes over $170 prior to the call expiring, the option is like being able to buy 100 shares at $170. So, given what I paid, I’d need TXN to reach $173 to break even on the option cost. Anything above that is profit.
That’s one scenario in which I’d make money here. The other is just as likely. That’s the case where TXN rallies in the next few weeks, but with time to expire.
As options pricing goes, the closer it gets to that strike price, with some time remaining, the more likely the option is to have value. In a market like this, it might just take a few days of positive returns on TXN to make the option nicely profitable. Especially if it happens soon.
TXN and the tech sector are always in focus for traders. And as I see it, there’s plenty of opportunity during this time of potential change in the long technology stock up cycle. So we might as well put our heads on a swivel and look at more ways to profit.
On the date of publication, Rob Isbitts did not have (either directly or indirectly) positions in any of the securities mentioned in this article. All information and data in this article is solely for informational purposes. For more information please view the Barchart Disclosure Policy here.
More news from Barchart
- Forget NVDA. This 1 Stronger Tech Stock Can Survive and Thrive in a Selloff. How to Trade It With Options Now.
- Down 11% Last Week, Should You Buy the Robinhood (HOOD) Discount? Here’s What You Need to Know
- Palo Alto Networks' Stock Has Tanked But Its FCF is Strong - Price Target is 15% Higher
- Option Volatility and Earnings Report for November 24 - 28
More News
View More


Recent Quotes
View More
Quotes delayed at least 20 minutes.
By accessing this page, you agree to the Privacy Policy and Terms Of Service.